New data on metro area employment and unemployment came out this morning, covering February 2014. Although unemployment data included revised statistics for February 2013, the fully revised series were still not available (nor were the revised figures for smoothed seasonally adjusted estimates). The full series of revised data are scheduled to be released April 18.
In the meantime, the new unemployment data show a similar pattern to the figures recently released for January. Specifically, unemployment rates for February 2013 were revised upward for all of the state’s metro areas, with the revisions ranging from +0.2% to +0.4%. But compared to these upwardly-revised rates from February 2013, unemployment rates in February 2014 were down in all 8 metro areas. The largest year-over-year declines were recorded for Fort Smith (-1.4%) and Memphis (-1.1%). Smaller declines were reported for Pine Bluff and Texarkana.
Source: Bureau of Labor Statistics
From January to February, nonfarm payroll employment was up in four of the state’s metro areas (Hot Springs, Jonesboro, Memphis, and Texarkana), unchanged in three (Fayetteville, Little Rock, and Pine Bluff), and declined in Fort Smith. Compared to February 2013, payroll employment was higher in all areas except Pine Bluff and Texarkana. The largest year-over-year percentage gains were for Hot Springs (+2.9%) and Jonesboro (+2.7%). Fayetteville and Jonesboro remain the only metro areas in the state that have higher employment now than pre-recession levels.
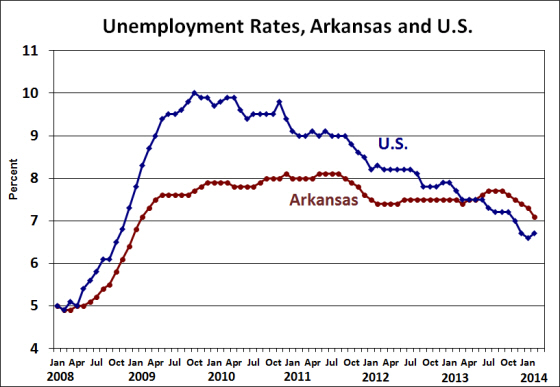
The February labor market reports from the Bureau of Labor Statistics revealed another month of positive employment growth for the state. The headline statistic was a decline in the unemployment rate from 7.3% to 7.1%. The national unemployment rate ticked upward by 0.1% in February, so the drop in Arkansas’ rate brought the gap between the state and national unemployment rates down to 0.4%. The Arkansas unemployment rate has now fallen 0.6% in the past 6 months, and it is 0.4% lower than a year ago.
Source: Bureau of Labor Statistics
The underlying data from the household survey showed a continuation–and acceleration–of recent positive trends. The number of unemployed declined by nearly 2,900, bringing the cumulative 6-month decline to more than 7,900. The number of employed rose by more than 5,300, raising the 6-month increase to over 13,700.
Source: Bureau of Labor Statistics, Local Area Unemployment Statistics (LAUS)
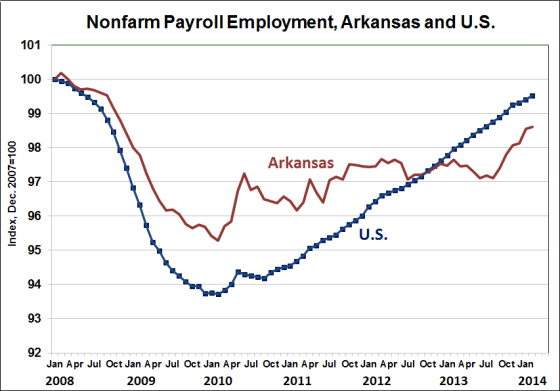
Payroll Survey The report on nonfarm payroll employment was similarly upbeat. The number of jobs increased by 800 in February (seasonally adjusted), following an upward revision to the data from January. After two years of stagnant job reports, payroll employment has increased by 18,000 over the past 6 months.
Source: Bureau of Labor Statistics
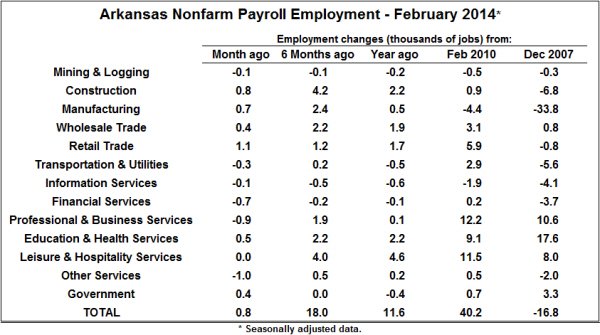
The table below breaks down the recent employment gains by sector. The data show another strong month for goods-producing sectors, with Construction up by 800 and Manufacturing up by 700. In the past 6 months we’ve seen a total increase of 6,600 in these two sectors alone. Employment changes in service-providing sectors were mixed in February, with increases in Retail Trade and Education & Health Services offset by losses on Professional & Business Services, Financial Services, and Other Services. Since the employment trough of February 2010 Arkansas has seen a cumulative increase of 40,200 jobs, but we remain 16,800 jobs below the employment levels that prevailed before the recession of 2008-09.
The season of employment data revisions is almost over — but not quite. A new report on metro area employment and unemployment from the Bureau of Labor Statistics includes some revised unemployment statistics for 2013, but the BLS data base will not be updated to reflect the full extent of data revisions until April 18. The table below summarizes the revised unemployment data that were made available this morning.
Source: Bureau of Labor Statistics
As we noted when the state unemployment revisions came out, the updated unemployment statistics included both good news and bad news. The bad news was that the state unemployment rate had been higher in 2012 and 2013 than previously-published data had suggested. The good news was that more recent data showed the unemployment rate trending downward. The same is generally true for Arkansas metro areas. Unemployment rates for January 2013 were revised upward by magnitudes ranging from 0.3 to 0.5 percentage points. On the other hand, the new data for January 2014 show substantial declines in unemployment for some Arkansas metro areas. Seven of the eight metro areas covering parts of Arkansas showed declines from a year earlier, with unemployment in Pine Bluff unchanged. Unemployment rates in Memphis and Fort Smith, in particular, have fallen dramatically since January 2013.
Payroll Data In a post earlier this week, we reported on the revisions to payroll employment data for Arkansas metro areas for 2012 and 2013. The table below shows the most recent updates to the monthly data–January 2014.
Source: Bureau of Labor Statistics
Employment increased in January in most of the state’s metro areas, with notable exceptions of Pine Bluff and Texarkana. In both of those southern-tier metro areas, employment was down not only for the month, but down over the past year as well. Pine Bluff and Texarkana are also the only metro areas in the state that have continued to shed jobs since the statewide employment trough of February 2010. At the other extreme, Jonesboro and Fayetteville have both seen employment growth of nearly 10 percent since February 2010. These two northern-most metro areas are also distinguished by the fact that they now have higher employment than at the onset of the recession.
The first employment report of the new year came out this morning, and the latest data suggest some positive developments. The headline from this morning’s release from the Department of Workforce Services was that the unemployment rate declined from 7.4% to 7.3%.
As we have noted recently, the annual exercise of data revisions has revealed notable weakness in Arkansas labor markets during 2012 and 2013. The unemployment rate has been persistently hovering around 7.5% as the national rate declined, and revisions to payroll employment were expected to show that fewer jobs were created last year than initial reports had suggested. Nevertheless, the newly-revised data also indicate that trends in both household employment and payroll employment have been improving in recent months.
Household Employment The unemployment statistics are based on a survey of households, with statistical models used to estimate changes in total employment and unemployment. As we recently reported, the revised data indicate that employment was lower and unemployment higher than initially reported during much of 2012 and 2013. But the new data also show an improving trend since August 2013. As shown in the figures below, January was the fifth consecutive month in which employment increased and unemployment declined. As a result of these improving trends, the unemployment rate dropped from 7.7% in July and August of last year to 7.3% in January 2014.
Source: Bureau of Labor Statistics
While Arkansas’ unemployment rate remained stubbornly high at around 7.5% during 2012 and 2013, the national unemployment rate has been falling. As a result, the national rate fell below Arkansas’ rate last summer. We expect the downward trend to continue, for both Arkansas and the U.S., but with Arkansas now lagging somewhat behind.
Source: Bureau of Labor Statistics
Payroll Employment The payroll employment statistics that came out this morning reflected new benchmark revisions for the period April 2012 through December 2013. As expected, the level of employment in mid-2013 was revised sharply downward — by approximately 11,000 jobs as of October 2013. Nevertheless, the routine monthly revision of the December statistics and a relatively strong gain in January employment (+4,500, seasonally adjusted) combined to suggest a significant improvement in recent employment trends. Consistent with the household data, the newly-revised payroll data show five consecutive months of employment gains, with a cumulative increase of 16,800 jobs since August 2013.
Sources: Bureau of Labor Statistics, Institute for Economic Advancement
The table below shows the breakdown of payroll employment by sector. The pattern of employment gains in January was somewhat atypical of the post-recession pattern: Some of the service-providing sectors which have been showing the largest gains since the end of the recession suffered declines in January, while goods-producing sectors showed some unexpected gains. Particularly noteworthy was the increase in construction employment — up 2,300 on a seasonally adjusted basis. Overall, nonfarm payroll employment was 12,400 higher in January 2014 than in January 2013. That represents a cumulative increase of 39,000 jobs since the post-recession trough of February 2010. Compared to pre-recession employment levels, however, we are still down by 18,000 jobs.
Source: Bureau of Labor Statistics
The revisions to both the household and payroll data show that labor market conditions in Arkansas were worse than we thought during much of 2012 and 2013, but both surveys indicate significantly improving conditions over the past five months. In the long, slow process of recovery from the recession of 2008-09, we are still lagging behind pre-recession labor market conditions — but recent data indicate emerging favorable trends.
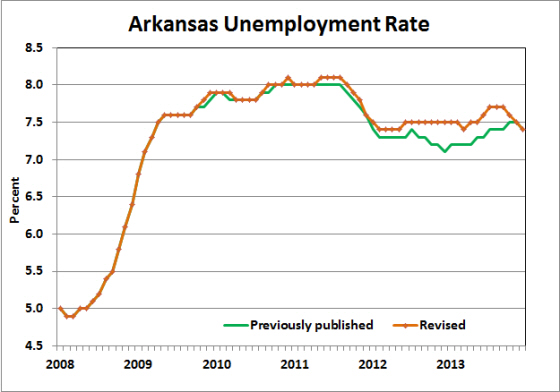
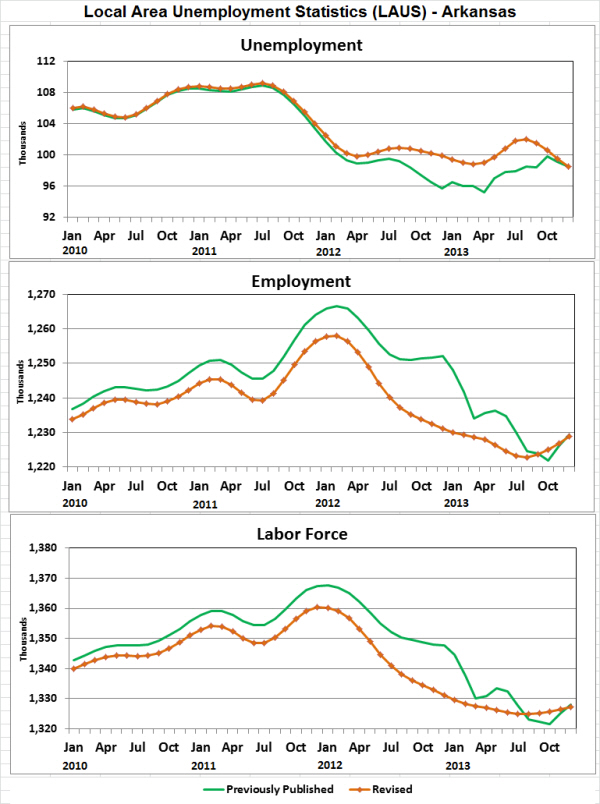
The Bureau of Labor Statistics has completed its annual review of state unemployment statistics, with revisions that incorporate new population data and model re-estimation. For Arkansas, the revised data show that the unemployment rate remained persistently high during 2012 and 2013. Previously-published data had suggested that the unemployment rate declined to as low as 7.1% at the end of 2012. The updated data indicate that Arkansas unemployment rate remained stuck at 7.5% through 2012 and into 2013. The new data also show the unemployment rate rising to 7.7% during the summer months of 2013, before declining to 7.4% in December 2013.
Source: Bureau of Labor Statistics
The figures below show the revisions to the underlying components of the unemployment rate. In late 2012 and early 2013, reports had suggested that the number of Arkansans unemployed dropped below 96,000. The revised data indicate that the true number hovered closer to 100,000, before rising to 102,000 in August. Meanwhile, the number of employed had been persistently overestimated: The downward revision to household employment averaged more than 9,000 during 2012 and 2013, reaching a peak of nearly 21,000 in December 2012. The net effect of these revisions was that the size of the Arkansas labor force had been also been persistently overestimated.
Source: Bureau of Labor Statistics
The downward revision to the level of household employment had the effect of reducing the magnitude of the measured change in 2013. Nevertheless, the BLS news release notes that Arkansas had the dubious distinction of having the second-largest decline in the employment-population ratio among the 50 states plus D.C. (-1.0 percentage point).
Household vs. Payroll Employment The revisions to the household employment data help to explain the puzzling divergence of the BLS’s two independent measures of state employment. Before the revisions, household employment was showing a contraction of over 36,000 jobs from January 2012 through December 2013. The revised data suggest that employment never rose as high as previously estimated, so the decline during 2012 and 2013 amounted to only 29,000 employed workers. This drop-off is still inconsistent with the data from the payroll survey, which shows an employment increase of 16,500 over the two-year period.
We are only days away from the release of revised estimates for payroll employment (March 17). The new payroll figures are likely to further narrow the gap between household and payroll employment (unfortunately). Our latest — and final — projection for the downward revision is for a downward shift of 11,400 payroll jobs as of December 2013.* If accurate, this would indicate that payroll employment expanded by only 5,000 jobs from January 2012 to December 2013. This still leaves a puzzling gap between the employment estimates from the household and payroll surveys, but the unexplained discrepancy is narrowing as more accurate estimates emerge.
Source: Bureau of Labor Statistics, Expected Revision Forecast by Institute for Economic Advancement
The latest revisions to the household employment data and the expected revision to the payroll employment data might not fully reconcile the discrepancies between the two series, but they do share a common theme: As weak as the Arkansas employment situation has appeared in recent months, emerging data suggest that it is even worse than we thought.
Yesterday’s news release from the Bureau of Labor Statistics summarized unemployment in the nation’s metropolitan areas as follows: “Unemployment rates were lower in December than a year earlier in 339 of the 372 metropolitan areas, higher in 25 areas, and unchanged in 8 areas.” In Arkansas, the counts were far less favorable. Compared to December 2012, unemployment rates were lower in only half of Arkansas’ metro areas — and by fairly small magnitudes. Unemployment rates were up in three metro areas, and up sharply in Pine Bluff and Texarkana. The rate in Little Rock was unchanged.
Source: Bureau of Labor Statistics, Local Area Unemployment Statistics (LAUS)
Smoothed seasonally adjusted estimates show that the most recent month-to-month changes were more favorable. From November to December, unemployment rates declined in four of the state’s metro areas, were unchanged three, and ticked up by 0.1% in Fort Smith.
Source: Bureau of Labor Statistics, Smoothed Seasonally Adjusted Metropolitan Area Estimates
Over time, the smoothed seasonally adjusted estimates show that progress toward lower unemployment stalled, at best (e.g. Fayetteville, Jonesboro, Little Rock) and has reversed in other areas (Pine Bluff, Memphis, Hot Springs, Texarkana). Overall, the state’s unemployment rate has been stuck in the range of 7% to 7.5% for the past two years.
Source: Bureau of Labor Statistics, Smoothed Seasonally Adjusted Metropolitan Area Estimates
Payroll Data The latest data from the payroll survey show similarly stagnant trends — at least for most of the state’s metro areas. From November to December, payroll employment declined in Fort Smith, Jonesboro, and Texarkana. Hot Springs showed a strong month-to-month increase, but was down 0.8% from the previous year. Pine Bluff and Texarkana also showed year-over-year declines.
Source: Bureau of Labor Statistics, Current Employment Statistics
Since the onset of the 2008-09 recession, 3 of the state’s 8 metro areas have recovered to the point of having positive net job growth: Jonesboro, Fayetteville, and Little Rock. The remaining Arkansas metro areas (along with the statewide total) remain below employment levels of December 2007. The chart below shows that patterns of employment growth around the state have been varied. While Fayetteville, Jonesboro and Little Rock have followed consistent recovery paths since the end of the recession, other areas have recovered more recently (e.g. Fort Smith, Hot Springs, Memphis). After an initial recovery phase, employment in Texarkana has been declining since early 2011. Pine Bluff has been on a downtrend throughout the recession and recovery periods.
Source: Bureau of Labor Statistics, Current Employment Statistics
Household/Payroll Divergence We have noted that the payroll and household surveys have been providing conflicting signals for statewide employment. This is also true at the metro-level. The following chart shows that the household measure of employment has been consistently under-reporting employment growth relative to the payroll measure. Although the magnitudes of the growth rates differ, both surveys show the similar relative performances among the state’s metro areas. Upcoming revisions (particularly to the payroll figures) might help reconcile the discrepancies between the two measures of employment.
The unemployment rate in Arkansas fell by 0.1% in December to 7.4%. Although the decline was smaller than the 0.3% decline in the national unemployment rate in December, it represented movement in the right direction. Over the past two years, the national unemployment rate has fallen by about 1.5 percentage points, while the Arkansas rate has been stuck in the range of 7% to 7.5%. During the recession of 2008-09 and for much of the subsequent recovery, Arkansas’ unemployment rate was significantly lower than the U.S. average. However, recent data show that the rest of the nation has overtaken Arkansas in terms of progress toward lower unemployment.
Source: Bureau of Labor Statistics
Today’s report showed that the number of employed Arkansans increased by approximately 3,200 in December, and that the number of unemployed declined by 600. This represents the second consecutive month that the household survey has shown higher employment and lower unemployment. As shown in the set of charts below, these changes represent a welcome change from trends in recent months.
Source: Bureau of Labor Statistics
Payroll Survey The payroll survey showed a net decline of approximately 900 jobs in Dececember. Construction employment was down for the month, although it remained 1,400 higher than in December 2012. Manufacturing employment showed no net change for the month. More surprising was the weakness in service-providing sectors: Some of the sectors that have been strong performers in recent months showed net employment declines in December, including Professional and Business Services (-1,100), Education and Health Services (-100) and Leisure and Hospitality Services (-300). On the other hand, increases were reported for both the Wholesale and Retail Trade sectors.
Source: Bureau of Labor Statistics
Overall, the payroll data show a net employent increase of 12,600 jobs since December 2012. But over the same period, the household survey has shown a net decline in employment of over 22,000. This was the final report for 2013, but the data are subject to subsequent revision. In late February the BLS will release updated estimates of household employment and unemployment, then in mid-March, the annual “benchmark revisions” for nonfarm payroll employment will be released. As noted in previous posts, the payroll data are likely to be revised downward, but it appears unlikely that the downward revision to payroll employment estimates will be enough to bring the two surveys back into alignment. At this point, it remains an open question as to which survey is providing more accurate readings on the state of Arkansas labor markets. Given current data, however, neither survey is suggesting a particularly strong performance.
Source: Bureau of Labor Statistics, Institute for Economic Advancement
Data on metro area unemployment rates that came out earlier this week indicated that Arkansas metro areas are generally not following the improving trend seen in the nationwide data. The news release from the Bureau of Labor Statistics noted that November unemployment rates were lower than a year earlier in 293 of the nation’s 372 metropolitan areas. In Arkansas, only Fort Smith was included in this count. As shown in the table below, year-over-year unemployment rate increases ranged from +0.1% in Fayetteville and Jonesboro to +1.1% in Pine Bluff. The rate was down 0.4% in Fort Smith.
Source: Bureau of Labor Statistics, Local Area Unemployment Statistics (LAUS)
Smoothed seasonally adjusted estimates for unemployment showed monthly increases in Hot Springs, Little Rock, Memphis, and Texarkana. The unemployment rate in Fort Smith was down 0.1% from the previous month. For the remaining metro areas (and the statewide average), unemployment was unchanged from October to November.
Source: Bureau of Labor Statistics, Smoothed Seasonally Adjusted Metropolitan Area Estimates
Payroll employment data for Arkansas metro areas were mixed. Although statewide employment increased by 3,000 (+0.3%) in November, three of the state’s metro areas showed monthly declines (Fort Smith, Jonesboro, and Texarkana) and employment in Pine Bluff was unchanged. The four remaining metro areas saw increases ranging from 0.2% in Little Rock to 0.8% in Hot Springs. Compared to a year ago, payroll employment is down Hot Springs, Pine Bluff and Texarkana, but has increased in the remaining metro areas.
Source: Bureau of Labor Statistics, Current Employment Statistics (CES)
Since the employment trough of February 2010, most of the state’s metro areas have shown net employment increases. However, employment in Texarkana seen a recent decline that erased earlier gains and employment in Pine Bluff has continued a downward trend that began well before the 2008-09 recession. Compared to the pre-recession peak, only three metro areas have shown net increases: Jonesboro, Fayetteville, and Little Rock.
The latest employment report from the U.S. Bureau of Labor Statistics and the Arkansas Department of Workforce Services might appear disappointing on the surface, but there were some positive developments. Despite an unemployment rate that was unchanged at 7.5% in November, the underlying data from the household survey moved in the right direction: the number of employed was up by nearly 4,400 and the number of unemployed was down by almost 700. The net change in the labor force was an increase of approximately 3,700. As shown in the set of figures below, these monthly changes represent a welcome departure from the overall trends we’ve been observing since the beginning of 2012.
Source: Bureau of Labor Statistics, Local Area Unemployment Statistics (LAUS)
To some extent, it was disappointing that we did not see a drop in the unemployment rate. The statistics for October had been distorted by the federal government shutdown. On the national level, the unemployment rate ticked up one-tenth of a percent in October, then dropped by three-tenths of a percent in November. In Arkansas, we saw the October increase but remained stuck at 7.5% in November.
Source: Bureau of Labor Statistics
Payroll Survey: The report on nonfarm payroll employment was also somewhat encouraging this month: employment was up 3,000 in November (seasonally adjusted) and the figures for October were revised upward by 1,500. As shown in the table below, employment increased in several sectors, including Professional & Business services, Leisure & Hospitality, Education & Health, and Construction. Over the past 12 months, the payroll survey is showing a net increase of 13,500 jobs.
Source: Bureau of Labor Statistics, Current Employment Statistics (CES)
Contrasting Trends and Data Revisions: As previously noted, the household and payroll surveys have been showing dramatically different trends over the past two years. Since January 2012, the household survey has shown a net decline of nearly 40,000 employed, while the payroll survey has registered an increase of 18,200. There can often be a discrepancy between two reports over short periods of time, but a divergence of this magnitude and duration is unusual. The monthly data for November showed the two series moving in the same direction, but the cumulative deviation remains substantial.
Some new data from the Quarterly Census of Employment and Wages (QCEW) released this week might help reconcile the conflicting trends — but not by much and not in an encouraging way. The data from the QCEW are used to periodically revise the payroll statistics. This “benchmark revision” takes place once per year, with the revised data released in March. Previously released data from the QCEW had suggested that revisions to the payroll statistics for 2013 would be minimal. However, the latest release showed a downward revision for the first quarter of 2013, along with a stagnant second quarter. As a result, it now appears likely that the 2013 payroll statistics will be revised sharply downward.
The figure below illustrates the diverging trends of the household and payroll statistics, along with a projection of how revised payroll data are likely to affect the comparison. The revision is expected to lower the level of measured payroll employment by over 15,000 (as of June 2013). As a result, the cumulative change in payroll employment from January 2012 through November 2013 is likely to be approximately +2,500 (down from the +18,200 change in the currently-reported data). This would partly close the gap between the household and payroll employment numbers, but a discrepancy of over 42,000 jobs would remain.
Sources: Bureau of Labor Statistics (LAUS, CES, QCEW), with calculations by the Institute for Economic Advancement
Still catching up with the backlog from the government shutdown, the Bureau of Labor Statistics last week released data for metro area employment and unemployment for both September and October. Not surprisingly, unemployment rates rose in October as federal workers and contractors on furlough were classified as unemployed. The smoothed seasonally-adjusted metro area estimates show that unemployment in October increased by 0.3% in Hot Springs and Pine Bluff, and by 0.2% in Little Rock. Fort Smith was the only metro area in the state that did not see an unemployment rate increase in October. In fact, Fort Smith’s rate was down by one-tenth from August.
Source: Bureau of Labor Statistics, Smoothed Seasonally Adjusted Metropolitan Area Estimates
Over the past year, unemployment rates in Arkansas have been on the rise. Statewide, the rate has risen from 7.2% in October 2012 to 7.5% in October 2013. Among the state’s metro areas, only Fort Smith has seen a net decline in unemployment over the same period, while Jonesboro was unchanged. Unemployment rates have risen in all of the other seven metro areas, with notable increases in Pine Bluff, Texarkana, Memphis and Hot Springs.
Source: Bureau of Labor Statistics, Smoothed Seasonally Adjusted Metropolitan Area Estimates
Payroll Employment Payroll employment figures (which should not have been affected by the government shutdown) showed some sizable gains in October. Employment in October rose by more than 1% in both Pine Bluff and Fort Smith. The increase in Fort Smith came on top of an increase in September as well. The only metro areas that saw a decline in payrolls for October were Hot Springs and Memphis. Compared to a year ago, employment was higher in all metro areas except Pine Bluff and Hot Springs.
Source: Bureau of Labor Statistics, Current Employment Statistics