Skip to content

Arkansas Employment and Unemployment – March 2026

The latest report on state employment and unemployment suggests that Arkansas labor markets are continuing to absorb an increasing labor force, but payroll employment growth is following a slowing trend.

The Arkansas unemployment rate edged lower, down from 4.4% in February to 4.3% in March. That change mirrored the U.S. unemployment rate. After several years of having lower unemployment than the rest of the nation, Arkansas is presently tracking right along with the national average.

Source: Bureau of Labor Statistics

The drop in March’s unemployment rate reflected two consecutive monthly declines in the number of unemployed. Meanwhile, the number of employed continued to rise, driving labor force higher. The trend in employment and labor force indicates that economy that is absorbing new entrants and re-entrants, with some experiencing periods of unemployment in the process.

Source: Bureau of Labor Statistics, Local Area Unemployment Statistics (LAUS)

The labor force participation rate was unchanged at 59.2% in March. Over the past three years we’ve seen a steady increase in Arkansas’ participation rate, while the national rate was holding steady, and more recently, trending downward.

Source: Bureau of Labor Statistics

Payroll Employment
Nonfarm payroll employment declined by 1,300 jobs in March, following a revised 500-job decline in February (seasonally adjusted data). The press release from the Arkansas Division of Workforce Services noted that job-gains in the not-seasonally adjusted data were largely seasonally related. For Construction, Leisure and Hospitality, and Government (which showed notable increases in the not-seasonally adjusted data), the seasonally adjusted measures indicate that any gains were associated with predictable seasonal patterns. After accounting for those patterns, adjusted employment declined slightly in all three of those sectors.

Source: Bureau of Labor Statistics, Current Employment Statistics (CES)

More generally, the data show a prevalence of sectors showing declines in March, with the largest loss in Retail Trade (-600). Among the handful of sectors showing higher employment, the most notable was in Education and Health Services (driven entirely by the Health Care and Social Assistance sector).

Compared to a year ago, employment changes across sectors are a mixed bag. The major service sectors continue to show robust growth, along with the sectors comprising Trade, Transportation and Utilities. Goods-producing sectors are all down over the year, along with Information Services, Financial Services, and Government.

The year-over-year growth rate of Arkansas payroll employment in March was only 0.5%. By this measure of growth, both Arkansas and the U.S. have been experiencing a notable downward trend. Nevertheless, the growth rate in Arkansas remains higher than the rest of the nation. The U.S. growth rate from March 2025 to March 2026 was only 0.2%.

Source: Bureau of Labor Statistics, Current Employment Statistics (CES)

# # #

Seasonally adjusted data for Arkansas nonfarm payroll employment, reported in a format consistent with the monthly news release from the Arkansas Division of Workforce Services, can be found here: Table-Seasonally Adjusted NFPE.

Arkansas Employment and Unemployment – February 2026

Still catching up with delayed data releases, the Bureau of Labor Statistics yesterday came out with state-level data on employment and unemployment for February. The headline news was that the unemployment rate was unchanged from January at 4.4%. It was previously reported that the U.S. unemployment rate increased from 4.3% to 4.4% from January to February, then reverted back to 4.3% in March. The differences between Arkansas and U.S. unemployment rates are tiny, and nowhere near the level of statistical significance.

Source: Bureau of Labor Statistics

The underlying data from the household survey are a bit more interesting: After rising steadily through nearly all of 2024 and 2025, the number of unemployed declined slightly in February. In conjunction with a similarly-small decline in December, the rising number of unemployed appears to have leveled-off. Meanwhile, the number of employed continued to increase in February, reaching a new record high.

Source: Bureau of Labor Statistics, Local Area Unemployment Statistics (LAUS)

The steady increase in the labor force has been outpacing the population growth rate, resulting in an increasing trend for the labor force participation rate. In it’s press release, the Arkansas Division of Workforce Services pointed out that February’s participation rate (59.2%) was the highest reading for that measure since October of 2012.

Source: Bureau of Labor Statistics

Payroll Employment
From the establishment survey, Nonfarm Payroll Employment was little changed in February (seasonally adjusted data). Sectors with declining employment included Durable Goods Manufacturing, Transportation and Utilities, and Other Services. Notable increases were recorded for Construction, Wholesale Trade, Education& Health, and Leisure & Hospitality Services. The gains and losses largely cancelled out, with the total declining by 100 jobs.

Source: Bureau of Labor Statistics, Current Employment Statistics (CES)

Over the past twelve months, the Arkansas economy added 9,100 payroll jobs, representing an increase of 0.7%. Over the same period, U.S. payroll employment expanded by only 0.1%. The year-over-year data for Arkansas show strong gains for Leisure & Hospitality Services, Education & Health Services, and Professional & Business Services. Declining sectors include Manufacturing (both durable and nondurable goods), Financial Services, Information Services and Government.

Since the pre-COVID peak of February 2020, Arkansas payrolls have expanded by 83,700, or 6.6%. Over the same period, U.S. payroll employment has grown by 4.0%.

Source: Bureau of Labor Statistics, Current Employment Statistics (CES)

# # #

Seasonally adjusted data for Arkansas nonfarm payroll employment, reported in a format consistent with the monthly news release from the Arkansas Division of Workforce Services, can be found here: Table-Seasonally Adjusted NFPE.

Metro Area Payroll Employment – Revisions & New Data for January

As discussed last week with regard to state payroll employment, this year’s annual benchmark revisions were unusually extensive for Arkansas. Typically, the published monthly data reported in Current Economic Statistics (CES) are revised by aligning the series with the more accurate benchmark data from the Quarterly Census of Employment and Wages (QCEW). The QCEW is based on state unemployment insurance records, so it is often referred to as “covered employment.”

This year, there was also a refinement of the methodology for estimating non-covered employment. The impact of that modification was then back-cast all the way to the beginning of the data series, 1990. For observations over the past several years, this revision had the effect of lowering the entire path of the data, but presumably leaves the short-run growth rates and fluctuations intact. In that sense, the shift in series levels had no significant economic effect.

For Arkansas metro areas, the level-shift portion of the revision affected Fayetteville-Springdale-Rogers, Fort Smith, and Little Rock-North Little Rock-Conway. There was no evident longer-term revisions for Hot Springs, Jonesboro, Memphis, or Texarkana (although seasonal factors were re-estimated for all series).

In order to identify the revisions due to the literal re-benching of the series to QCEW data, we can express the pre-revision and post-revision series as indexes, where the two series are aligned as of a certain date. As we have done in past analysis, we will use February 2020 as the reference point. The figures below illustrate the nature of the benchmark revisions that affected recent growth rates and trends.

Source: Bureau of Labor Statistics

The impacts of these revisions on recent growth trends are summarized in the table below. Among the one-year growth rates, all metro areas except for Jonesboro and Hot Springs showed downward revisions. Over the longer span—since February 2020—only Hot Springs and Little Rock were revised higher. For Memphis and Texarkana, the revisions changed positive growth figures into negatives—over both time horizons.

Source: Bureau of Labor Statistics

Latest Data
The newest data released last week covered January 2026. With the revised history now incorporated into the data, the chart and table below summarize the most recent growth rates and trends.

Source: Bureau of Labor Statistics

Arkansas GDP – 2025:Q4

Real GDP growth slowed significantly in the fourth quarter of 2025. The third estimate for national GDP reported an annualized growth rate of 0.5%, down from 4.4% in the third quarter. Arkansas growth slowed to 0.4% in the fourth quarter, declining from a 5.8% pace in the third quarter.

Source: Bureau of Economic Analysis

A breakdown of GDP by industry shows several sectors that contributed positively to fourth quarter growth, both nationally and here in Arkansas. Examples include Wholesale trade, Retail trade, and Health Care & Social Assistance. Sectors subtracting from growth included Nondurable Goods manufacturing and Federal government employment.

Source: Bureau of Economic Analysis

Another factor suppressing GDP growth for Arkansas was a decline in Agriculture, etc. component. Just as large swings in agricultural income have been creating volatility in Arkansas Personal Income growth rates, the output of the agriculture sector has been introducing noticeable fluctuations in real GDP growth as well. In terms of year-over-year growth rates, the agriculture sector had the effect of lowering Arkansas GDP growth in 2023 and boosting it in 2024. As of the fourth quarter of 2025, four-quarter growth for the U.S. was 2.0% and only 1.5% for Arkansas. Removing the agriculture sector from the Arkansas aggregate, the state’s non-agricultural GDP growth was 2.1%.

Longer-term trends show that Arkansas GDP growth has outpaced the U.S. over the past 6 years. Cumulative growth rates from 2019:Q4 forward show growth of 17.8% in Arkansas and 14.6 for the U.S. total.

Arkansas Personal Income – 2025:Q4

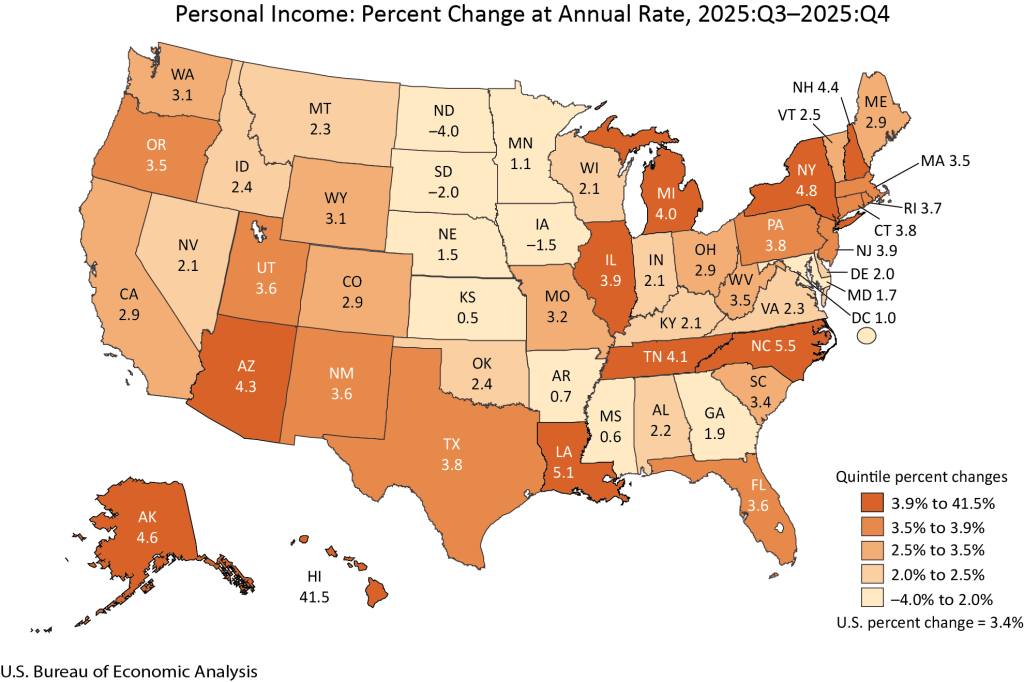
Personal income data for the fourth quarter of 2025 report another relatively weak quarter of growth for Arkansas. On an annualized basis, Arkansas personal income expanded at a 0.7% rate, compared to 3.4% for the U.S. average.

Arkansas and the rest of the nation have seen slowing income growth in 2025. After a strong first quarter, Arkansas growth rate for the rest of the year averaged below 1%. The U.S. growth rate has slowed as well, although not so dramatically.

Source: Bureau of Economic Analysis

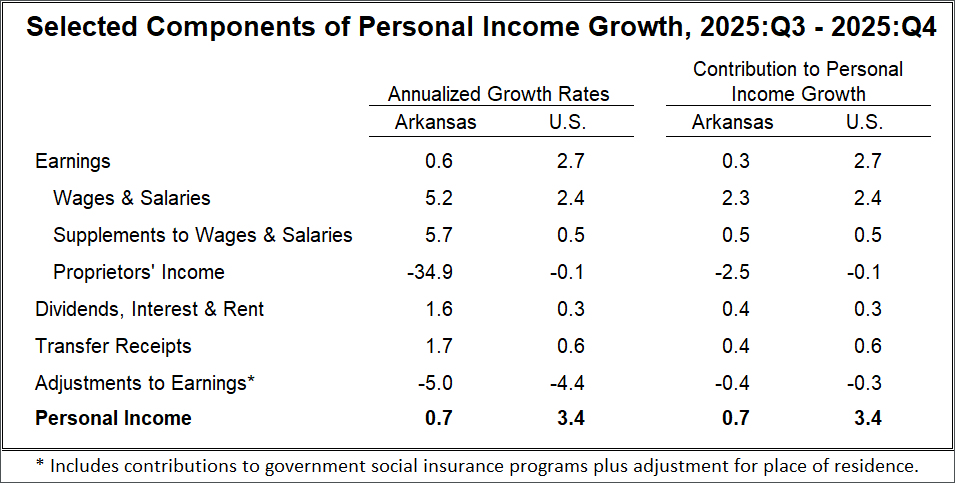
A breakdown of the components of personal income growth shows ongoing growth in Wages & Salaries; Dividends, Interest & Rent; and Transfer Receipts. The category most responsible for suppressing earnings growth was Proprietors’ Income.

Source: Bureau of Economic Analysis

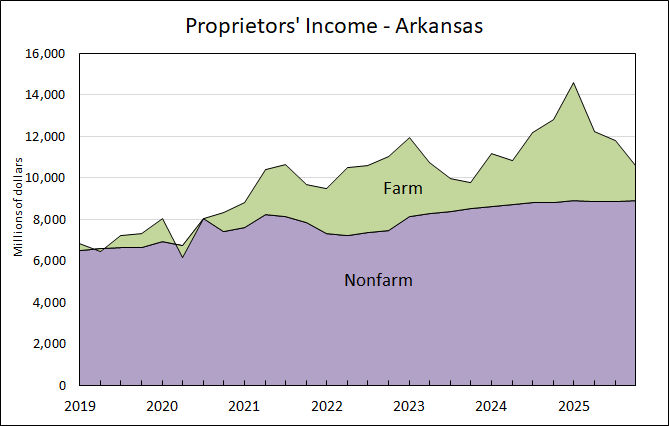
Regular readers of the Arkansas Economist should be able to guess the underlying source of weakness in Proprietors’ Income in the fourth quarter: Farm Income. The farm component of proprietors income, while accounting for only a small fraction of personal income, has been exhibiting highly variable growth patterns in recent years. As illustrated in the figure below, Non-farm Proprietors’ Income has been expanding steadily (albeit at a decelerating rate), while Farm Proprietors’ income drive the major fluctuations overall.

Source: Bureau of Economic Analysis

Some of the quarterly volatility in personal income growth can be smoothed by considering four-quarter moving-average growth rates. Adjusting total income growth to exclude farm income reveals an even steadier growth trend. Income growth has been slowing nationwide and the smoothed trend for Arkansas shows roughly similar pattern.

Source: Bureau of Economic Analysis

Over the longer-run, Personal Income growth since the beginning of 2020 has cumulatively totaled 41.2% for the U.S. and 43.2% in Arkansas.

Source: Bureau of Economic Analysis

Arkansas Employment and Unemployment – January 2026

After longer-than-usual delays associated with federal government shutdowns last year, the Bureau of Labor Statistics finally released new state-level employment data for January 2026, along with the annual data revisions. In general, the revised and updated data paint a picture of weaker labor market conditions than were indicated by the unrevised data.

A case in point is Arkansas’ unemployment rate. As shown in the figure below, the pre-revision data was showing a gradual increase in unemployment during the second half of 2024 and through all of 2025. After revision, we see that the increase in unemployment took place more rapidly during 2025 than originally estimated. By the end of the year, the unrevised data a state unemployment rate of 4.2%, with a revised figure for December of 4.3%. Although this is a relatively small revision for December, the data for the summer months was revised to show unemployment rates as much as 0.4% higher than originally published.

The new information for January 2026 shows an unemployment rate of 4.4%, one-tenth of a percentage point higher than the U.S. average (although the difference is not statistically significant).

Source: Bureau of Labor Statistics, Local Area Unemployment Statistics (LAUS)

Payroll Employment
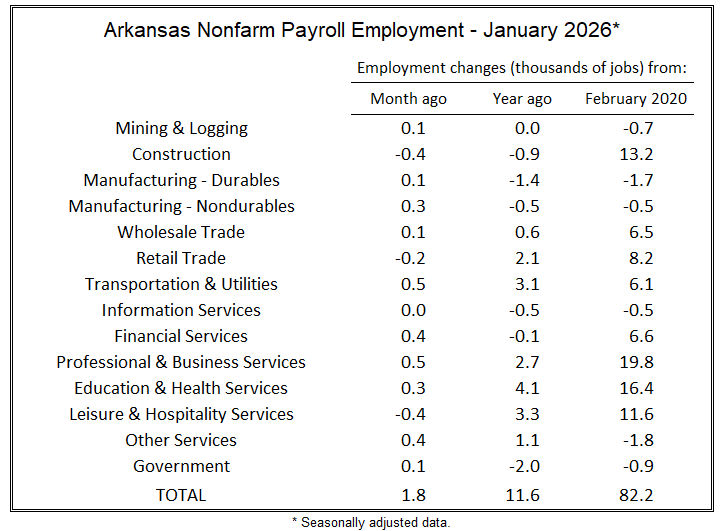
Nonfarm payroll employment was also subject to annual benchmark revisions (discussed below). For January, payroll employment increased by 1,800 jobs (seasonally adjusted, revised data). As shown in the table, most sectors saw employment gains, with the exception of Construction, Retail Trade, and Leisure & Hospitality Services.

Source: Bureau of Labor Statistics, Current Employment Statistics (CES)

Over the past year, most sectors have experienced employment growth, with an overall increase of 11,600 jobs (approximately 0.9%). particularly notable are declining employment figures for Construction and Manufacturing. For manufacturing (both durable and nondurable goods), the newly revised data show that employment is lower now than it was prior to the onset of the COVID pandemic. This is a revelation that stems from the new data revisions.

Payroll Data Revisions
The annual benchmark revisions for nonfarm payroll employment were significantly larger than usual–at least for Arkansas. As of December 2025, the new total for payroll employment is 3.7% lower than previously reported. This was the largest revision among the 50 states plus District of Columbia.

A significant share of the downward revision was attributable to a rebasing of the entire employment series. Data as far back as 1990 was revised significantly lower, affecting the level of employment not just for recent years, but throughout the entire history of employment data for the state. An inquiry to the Arkansas Division of Workforce Services yielded an explanation that this source of revision had to do with the way non-covered employment was calculated (i.e., employment not subject to unemployment insurance). Because these revisions shifted the level of the entire structure of employment over 36 years, this source of revision is not economically significant. That is, the changes have little impact on recent employment growth trends.

On the other hand, the usual benchmarking process that uses updated source data over the past two years was also larger than usual. Of particular note were revisions to employment growth in manufacturing. As shown in the figures below, growth over the past 15-18 months has been considerably slower than previously reported. From October 2024 through December 2025, the originally-published data showed an increase of 1.9% for durable goods employment and 1.2% for nondurable goods employment. After revision the new series show a decline of 3.5% for durable goods, and zero net change in nondurable goods.

Source: Bureau of Labor Statistics, Current Employment Statistics (CES)

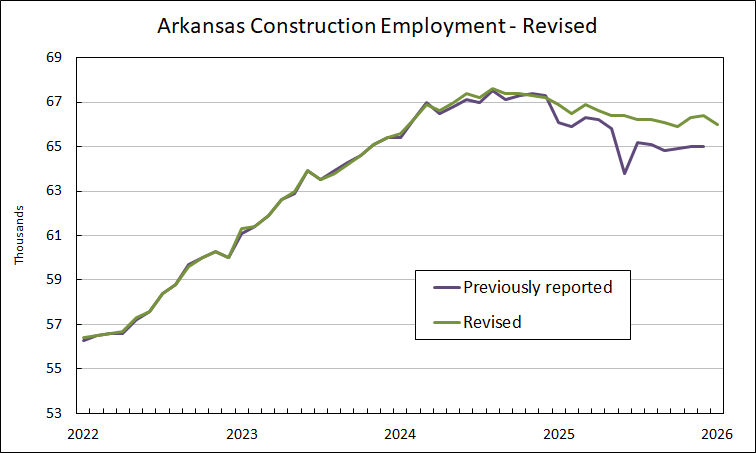
The other goods-producing sector that has shown declining employment over the past 12 months, construction, had a different revision pattern. Although construction employment has been declining for the past 18 months, the revised data show the decline to be attenuated relative to the originally-published figures.

Source: Bureau of Labor Statistics, Current Employment Statistics (CES)

In order to control for the long-term rebasing of the series back to 1990, we can examine the employment index that we usually use to compare growth trends in Arkansas with the U.S. By using index values using the pre-COVID month of February 2020 as a base period, it is possible to compare trends before and after revision with the total U.S. equivalent. As shown below, the newly revised data show a slower recovery of employment from mid-2020 through 2022, as well as a slower growth trend in 2024 and 2025. Overall, the revised data show employment in December 2025 was 6.3% higher than in February 2020, while the previously-published data had shown 7.7% growth over that period.

The Figure below shows year over year growth rates for 2023-2025. The new revisions have the effect of raising Arkansas employment growth in 2023 (from 1.2% to 1.8%), and lowering growth in 2024 and 2025. Notably, the revised Arkansas employment data show higher growth rates than the U.S. over all three years. In particular, even the 0.65% growth rate in 2025 outpaces the near-zero growth for the U.S. total.

Source: Bureau of Labor Statistics, Current Employment Statistics (CES)

# # #

Seasonally adjusted data for Arkansas nonfarm payroll employment, reported in a format consistent with the monthly news release from the Arkansas Division of Workforce Services, can be found here: Table-Seasonally Adjusted NFPE.

Metro Area Employment and Unemployment – December 2025

Arkansas metropolitan areas ended the year 2025 with rising unemployment rates, juxtaposed against a backdrop of employment growth that is slowing in some parts of the state but continuing to expand in other areas.

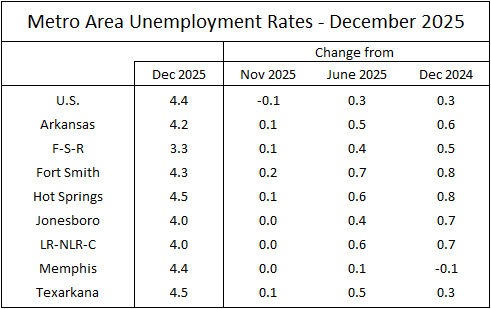
In December, unemployment rates were either unchanged or slightly higher than the previous month. Over the past several months, the rise in unemployment has been significant, with rates increasing by 0.4 to 0.7 percentage points in just the second half of the year (with the notable exception of Memphis, which has maintained a relatively steady unemployment rate).

Source: Bureau of Labor Statistics, Smoothed Seasonally Adjusted Metropolitan Area Estimates

Payroll Employment
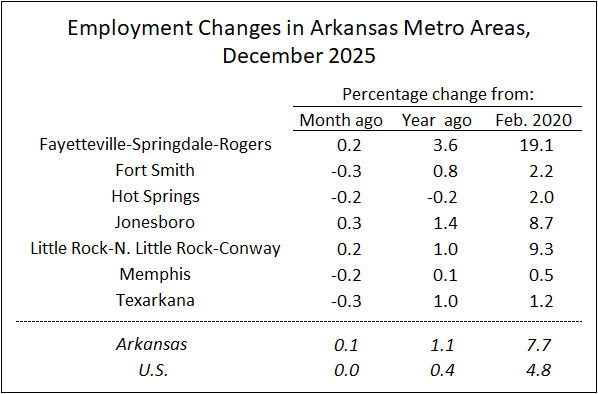
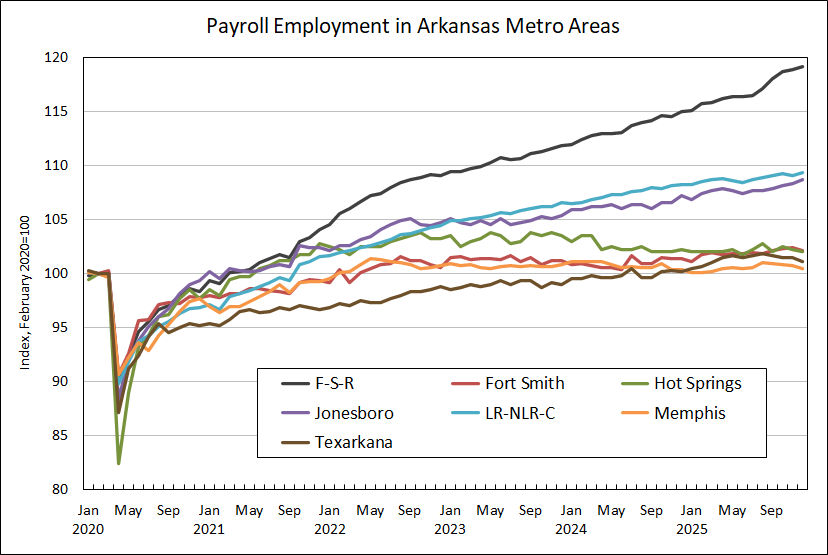
Nonfarm payroll employment changes were mixed in December. Fort smith, Hot Springs, Memphis and Texarkana experienced declining employment for the month, while Northwest Arkansas, Central Arkansas, and Jonesboro registered employment gains.

Source: Bureau of Labor Statistics, Current Employment Statistics (CES)

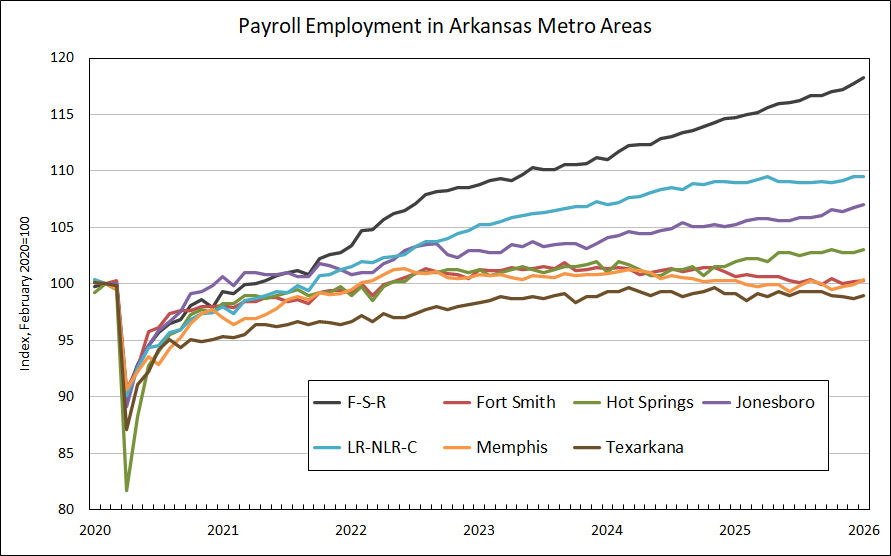
The pattern of relative growth rates is evident in longer term trends as well. Northwest Arkansas has consistently shown the strongest job growth in the state, with Central Arkansas and Jonesboro maintaining relatively strong growth rates as well. Over the most recent 12 months, Texarkana has also trended higher. Fort Smith, Hot Springs, and Texarkana have grown relatively slowly over the past five years, increasing by only one or two percent relative to February 2020.

Source: Bureau of Labor Statistics, Current Employment Statistics (CES)

County Unemployment Rates
An end-of-year snapshot of unemployment rates around the state shows a typical pattern. The areas of high unemployment are concentrated in the southeast, with some high-unemployment counties in north-central Arkansas as well. In and around the rapidly growing metropolitan areas, unemployment rates remain below 4%.

Arkansas Employment and Unemployment – December 2025

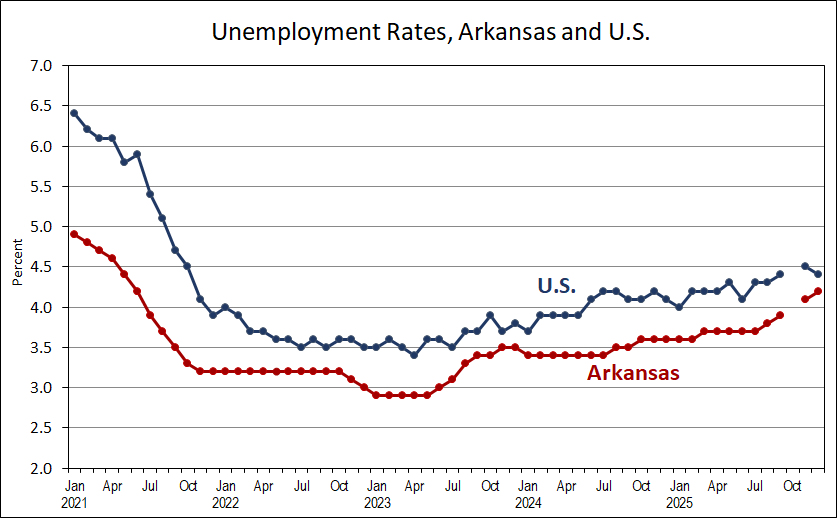
State-level employment data for the end of 2025 came out today. Both the payroll survey and the household survey continue to show employment growth, but the number of unemployed in the household survey has also been rising sharply. In December, the Arkansas unemployment rate rose from 4.1% to 4.2%. The U.S. unemployment rate had previously been reported to have ticked down by 0.1 percentage points to 4.4 for December.

Source: Bureau of Labor Statistics

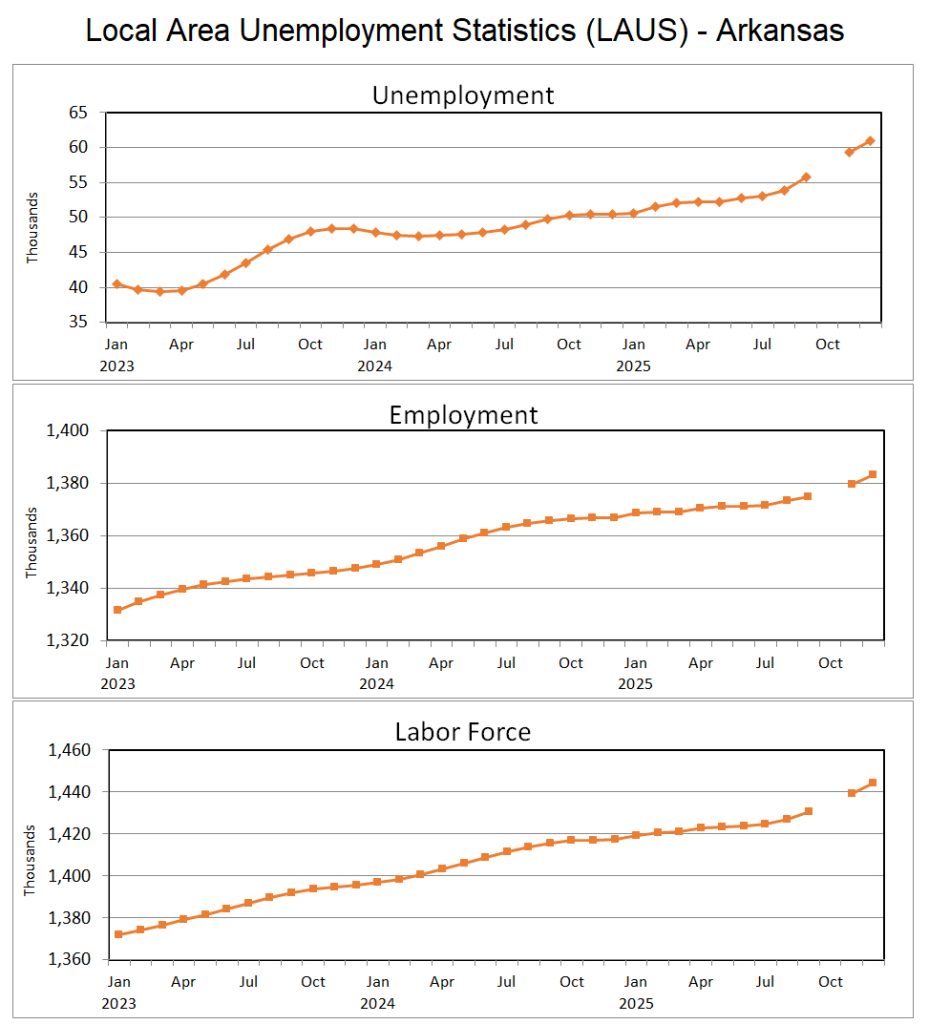
The increase in Arkansas’ unemployment rate over the second half of 2025 has been driven by a steady increase in the number of unemployed, which was up 1,621 in December and had risen by 8,285 since June. The number of unemployed topped 60,000 in December for the first time since 2015 (if we ignore the covid spike in 2020). But meanwhile, employment growth has continued. The number of employed was up by 3,541 in December, and had risen by 12,125 since between June and December. The resulting increase in the labor force has kept the rising unemployment from having larger effects on the unemployment rate.

Source: Bureau of Labor Statistics, Local Area Unemployment Statistics (LAUS)

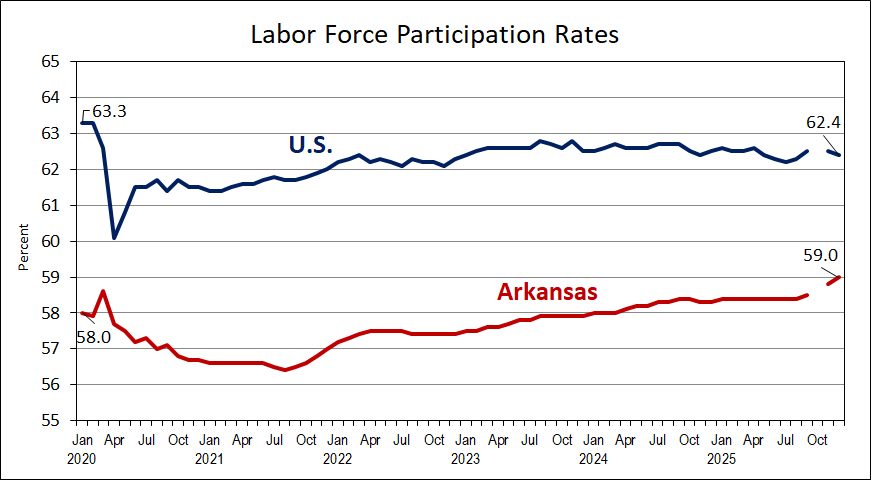
The rising labor force has also resulted in an increase in Arkansas’ labor force participation rate, which ticked up another 0.1 percentage point to 59.0% in December.

Source: Bureau of Labor Statistics

Payroll Employment
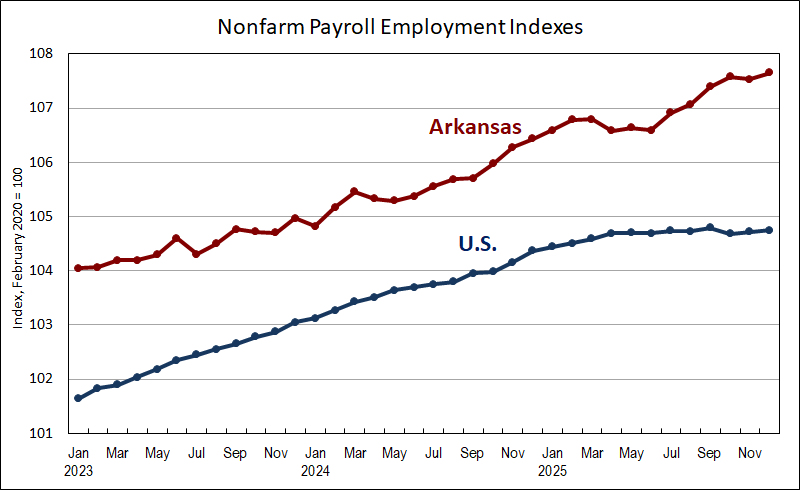
Data on nonfarm payroll employment also showed an increase in jobs in December, up 1,500 from November (seasonally adjusted data). However, the total for November was revised downward by 1,400, resulting in a net increase of only 100 from October to December. Over the past 12 months, Arkansas employment increased by 15,700 jobs, or by about 1.1%. The slowdown in U.S. payroll employment growth has been more notable, with national job growth up only 0.4% from a year earlier.

Source: Bureau of Labor Statistics, Current Employment Statistics (CES)

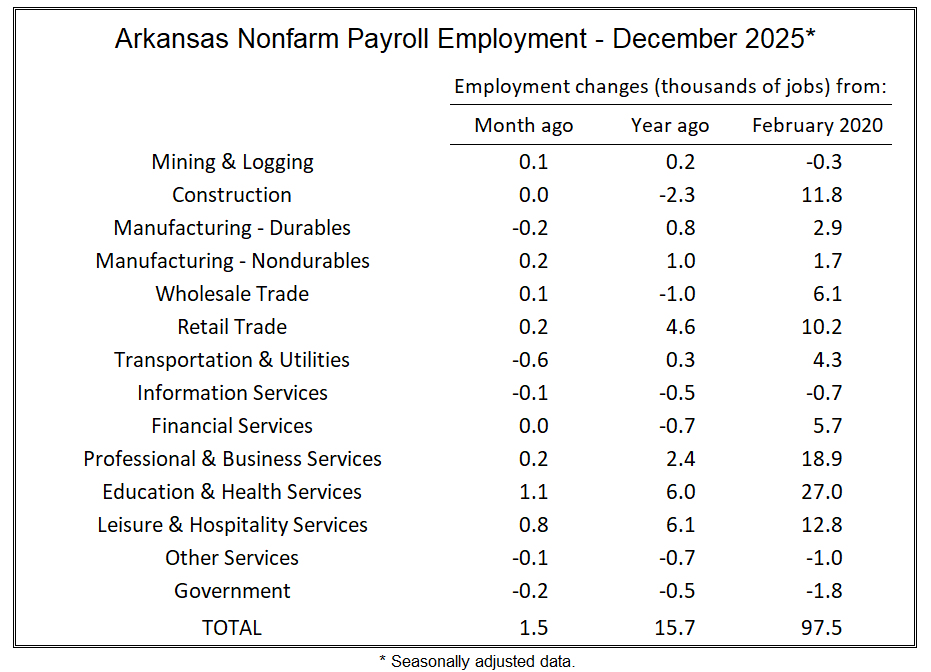
The breakdown of Arkansas employment growth from November to December shows mixed changes across industries. Education and Health Services and Leisure & Hospitality Services showed notable increases, while Transportation and Utilities declined. Other sectors showed small changes for the month.

Source: Bureau of Labor Statistics, Current Employment Statistics (CES)

The breakdown of employment growth over the past year shows that the industries experiencing the largest employment gains were Education & Health and Leisure & Hospitality. Retail Trade also showed a large year-over-year increase.

This is the last employment report before annual revisions. The revised data will be released sometime in April (as delays from the federal government shutdown continue to cause delays in the reporting schedule).

# # #

Seasonally adjusted data for Arkansas nonfarm payroll employment, reported in a format consistent with the monthly news release from the Arkansas Division of Workforce Services, can be found here: Table-Seasonally Adjusted NFPE.

Arkansas GDP – 2025:Q3

GDP data from the third quarter of 2025 show a sharp rebound in Arkansas’ production after a slow first half of the year. Real GDP increased at an annual rate of 5.8% in Q3, compared to the U.S. growth rate of 4.4%. Arkansas was reported to have the third-highest growth rate in the nation. Over the most recent four quarters, Arkansas GDP growth was 2.2% and the U.S. growth rate was 2.3%.

Source: Bureau of Economic Analysis

The news release from the Bureau of Economic Analysis noted that Durable Goods Manufacturing was the leading contributor to growth in 13 states, including Arkansas where it contributed 0.89 percentage points. Other contributors to Arkansas’ growth included Wholesale Trade, Retail Trade, as well as Health Care. The only sectors in Arkansas showing declines were Construction and Government.

Source: Bureau of Economic Analysis

Cumulatively, Arkansas GDP has grown by 17.7% since the pre-covid level of 2019:Q4. Over the same period, U.S. GDP has expanded 14.5%. The figure below also illustrates the sensitivity of Arkansas GDP growth to recent swings in the Agriculture, Forestry, Fishing & Hunting component. Suppressing the effects of this component has little impact on the state’s third-quarter growth, but reveals that long swings in growth since 2023 are largely attributable for corresponding swings in total GDP growth.

Source: Bureau of Economic Analysis

Arkansas Personal Income – 2025:Q3

Delayed by a month due to the federal government shutdown, state-level data are now available for Personal Income for the third quarter of 2025. Total Personal Income increased at an annual rate of 3.1%, slightly lower than the 3.3% U.S. average. Year-over-year growth rates were 4.9% for Arkansas and 4.7% for the U.S.

Source: Bureau of Economic Analysis

A breakdown of the components of income growth shows solid growth in Wages & Salaries and Transfer Receipts, accompanied by a sharp offsetting drop in Proprietors’ Income, which resulted in lowering total income growth by 0.8%.

Source: Bureau of Economic Analysis

As has frequently been the case in recent quarters, the drop in Proprietors’ Income was mostly in the Farm Component. Nonfarm Proprietors’ Income increased at a modest rate of 0.6%, while Farm Proprietors’ Income declined at a 38.1% rate.

Source: Bureau of Economic Analysis

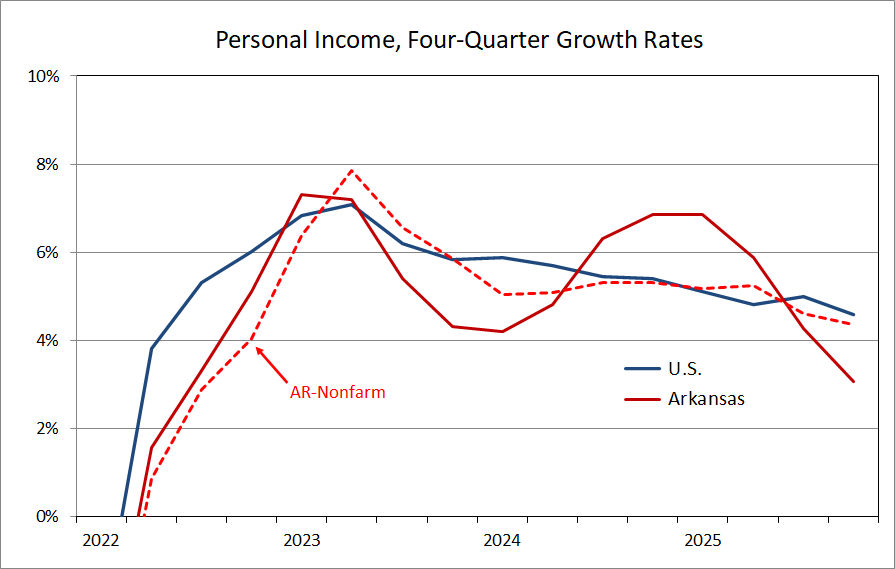
To some extent, the recent swings in Farm Income have obscured the general underlying trends. As illustrated with four-quarter growth rates, Arkansas Personal Income growth has swung below and above the U.S. growth rate over the past two years, but after removing the Nonfarm Proprietors’ income component, income growth has been relatively steady at between 5% and 5-1/2%. In 2025:Q3, this adjusted Nonfarm Income measure increased by 5.1%.

Source: Bureau of Economic Analysis