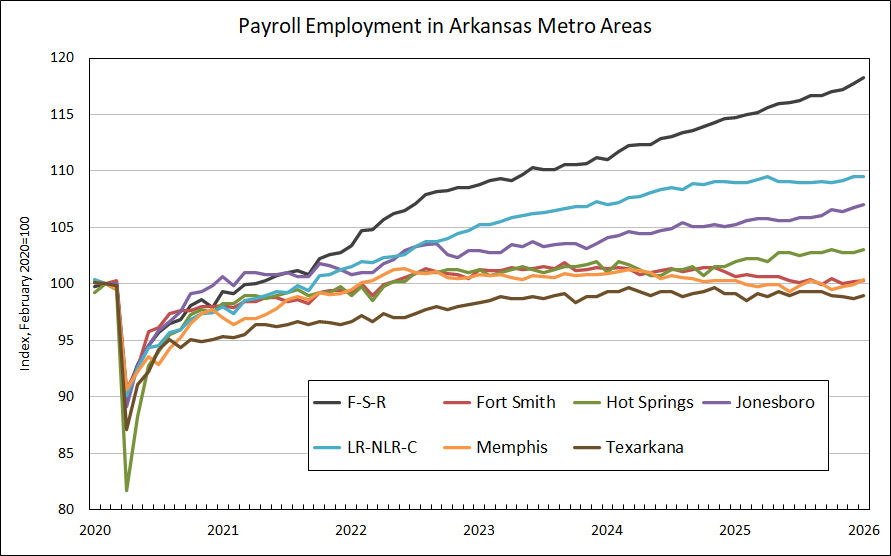
As discussed last week with regard to state payroll employment, this year’s annual benchmark revisions were unusually extensive for Arkansas. Typically, the published monthly data reported in Current Economic Statistics (CES) are revised by aligning the series with the more accurate benchmark data from the Quarterly Census of Employment and Wages (QCEW). The QCEW is based on state unemployment insurance records, so it is often referred to as “covered employment.”
This year, there was also a refinement of the methodology for estimating non-covered employment. The impact of that modification was then back-cast all the way to the beginning of the data series, 1990. For observations over the past several years, this revision had the effect of lowering the entire path of the data, but presumably leaves the short-run growth rates and fluctuations intact. In that sense, the shift in series levels had no significant economic effect.
For Arkansas metro areas, the level-shift portion of the revision affected Fayetteville-Springdale-Rogers, Fort Smith, and Little Rock-North Little Rock-Conway. There was no evident longer-term revisions for Hot Springs, Jonesboro, Memphis, or Texarkana (although seasonal factors were re-estimated for all series).
In order to identify the revisions due to the literal re-benching of the series to QCEW data, we can express the pre-revision and post-revision series as indexes, where the two series are aligned as of a certain date. As we have done in past analysis, we will use February 2020 as the reference point. The figures below illustrate the nature of the benchmark revisions that affected recent growth rates and trends.

The impacts of these revisions on recent growth trends are summarized in the table below. Among the one-year growth rates, all metro areas except for Jonesboro and Hot Springs showed downward revisions. Over the longer span—since February 2020—only Hot Springs and Little Rock were revised higher. For Memphis and Texarkana, the revisions changed positive growth figures into negatives—over both time horizons.

Latest Data
The newest data released last week covered January 2026. With the revised history now incorporated into the data, the chart and table below summarize the most recent growth rates and trends.