The AEDI Retail Sales index for Arkansas shows a sharp weakening of consumer spending in the second quarter of 2022. The index for total Retail Trade and Food Service Sales declined by 5.5% from the first quarter of the year, and was down 4.0% from a year earlier. The official census bureau measure for the U.S. increased by 0.5% for the quarter, and was up 2.2% from the previous year.
Sources: Census Bureau, Arkansas Economic Development Institute
One possible mitigating factor, as mentioned in our analysis of first-quarter data, the recent change in the time allowed for motor vehicles to be registered after purchase (from 30 days to 60 days) has altered the relationship between sales-date and when the tax revenue is reported. As a result, our methodology might have overestimated sales in late 2023 and underestimated 2024 sales. Our data show that spending at Motor Vehicles and Parts Dealers was down by 10% in the second quarter. Nevertheless, Retail Trade and Food Service Sales Excluding Autos was down 3.9%.
As shown in the table below, consumer spending appears to have fallen across all retail sectors. The largest quarterly decline was in the motor vehicles component, but several other sectors show notable declines as well.
Sources: Census Bureau, Arkansas Economic Development Institute
Sales at Electronics and Appliance Stores were higher in the second quarter than the first, but still down sharply from a year earlier. The only spending categories that were higher than in the second quarter of 2023 were Food and Beverage Stores and Food Services and Drinking Places. In both cases, the year-over-year increases were significantly smaller than their nationwide counterparts in the Census Data.
Sources: Census Bureau, Arkansas Economic Development Institute
Sources: Census Bureau, Arkansas Economic Development Institute
Simultaneously with the release of second quarter Personal Income, the BEA also released new data for state GDP growth. As was the case with personal income, the comprehensive revisions to past data are more significant than the newly-reported second-quarter statistics.
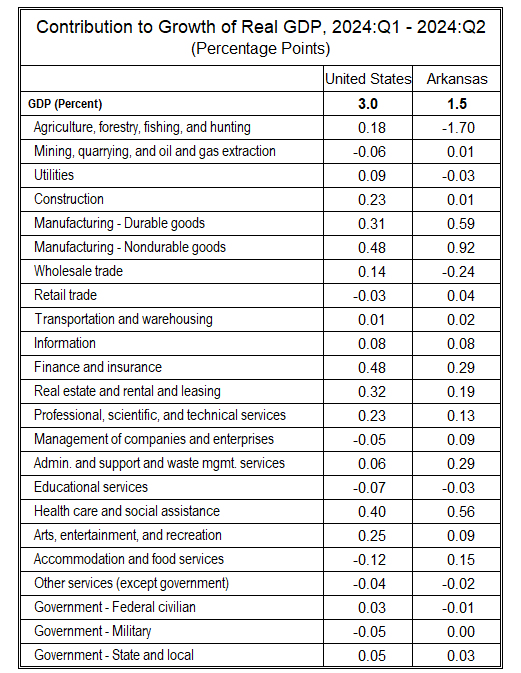
The data for 2024:Q2 showed Arkansas GDP growing at an annual rate of 1.5%, compared to a 3.0% rate for the U.S. The news release from the BEA reported that GDP “increased in 49 states and the District of Columbia in the second quarter of 2024, with the percent change ranging from 5.9 percent at an annual rate in Idaho to –1.1 percent in Alaska.
The table below shows a breakdown of Arkansas and U.S. GDP growth by sector. Not surprisingly, the volatile agriculture component accounts for more than the difference between U.S. and Arkansas growth rates. Both nationally and here in Arkansas, growth in manufacturing as well as finance, real estate, professional services, and health services contributed notably to GDP growth.
Source: Bureau of Economic Analysis
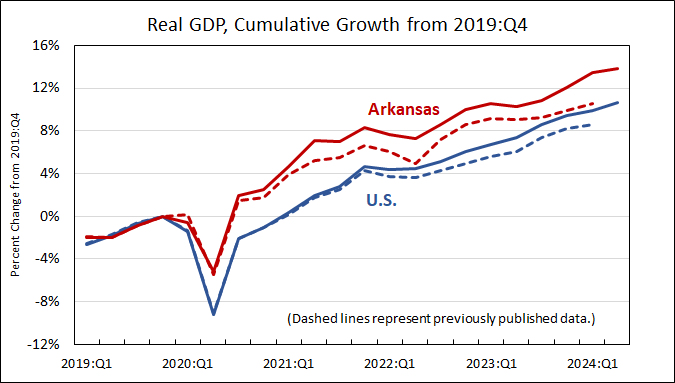
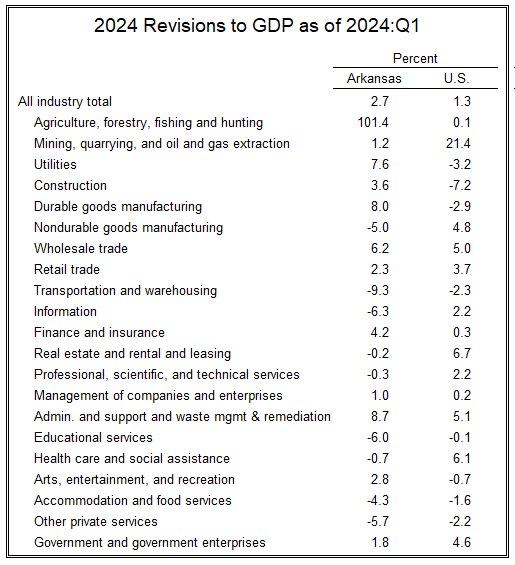
Data Revisions The revisions to GDP over the past five years are of greater interest than the most recent quarterly growth rate. As shown in the figure below, the upward revisions to GDP growth—particularly for Arkansas—are far larger than the most recent quarterly uptick. The revised data for Arkansas show stronger growth in 2020 and 2021 than previously indicated, and the brief contraction in the first half of 2022 is now estimated to have been smaller. The cumulative result of the revisions was to raise Arkansas GDP by 2.7% as of the first quarter of 2024. The U.S. data were also revised higher, but only by 1.3% as of the first quarter.
Source: Bureau of Economic Analysis
The revisions included higher estimates for all goods-producing sectors in Arkansas, but were generally downward revisions for some of the fastest-growing service sectors (including Education, Health Care and Accommodation & Food Services).
Source: Bureau of Economic Analysis
The two sectors with the largest upward revisions were Agriculture, etc., and Durable Goods Manufacturing. The upward revision for Agriculture more than doubled the originally-published estimate. The most important change was that the previously-reported decline in the first half of 2023 was revised to be considerably smaller.
Source: Bureau of Economic Analysis
The other sector with a substantial revision was durable goods manufacturing. In this case, the revision shows much stronger growth in 2020-21, with the higher level of output being maintained in 2022 and 2023.
Source: Bureau of Economic Analysis
The net result of the new quarterly data, along with the revisions, is that Arkansas GDP in the second quarter was cumulatively 13.9% higher than it was in 2019:Q4. Cumulative growth for the U.S. over the same time period amounted to 10.7%.
The latest report on state-level personal income came out late last week. The significance of the most recent data is of interest, but its relevance for our current situation and outlook for the near future is eclipsed by data revisions that substantially altered some key components of recent income growth.
First, the most recent numbers: In the second quarter, Arkansas Personal Income expanded at an annualized rate of 4.3%, one percentage point lower than the national average of 5.3%. Growth rates ranged from a high of 6.9% in South Carolina to a low of 2.3% in North Dakota. Arkansas ranked #40 among the 50 states.
The composition of income growth in the fourth quarter shows that the Earnings component fully accounted for the fact that Arkansas’ growth rate was slower than the national average. Dividends, Interest, and Rent as well as Transfer Receipts each contributed about the same amount to income growth in Arkansas compared to the U.S.
Source: Bureau of Economic Analysis
As shown in the further breakdown below, the shortfall in earnings was entirely attributable to Proprietors’ Income. Not surprisingly, given its recent volatility, Farm Proprietors’ income accounted for most of that decline, falling at an annualized rate of 76%. Nonfarm Proprietors’ Income increased at a rate of 3.3%.
Source: Bureau of Economic Analysis
The figure below puts the most recent change into context relative to the (revised) trends. Expressed as index values normalized to 2020:Q1=100, the figure shows that Arkansas Personal Income has shown cumulative growth of 36.4% compared to 31.4% for the U.S. To adjust for the recent volatility of farm income, the figure also shows a measure of personal income excluding farm income. By that measure, the acceleration of income growth in 2022 and the slowdown in 2023 are smoothed out considerably.
Source: Bureau of Economic Analysis
Data Revisions The data revisions that underly the figure above are more significant than the most recent quarterly growth rate. The latest report incorporated the results of BEA’s annual updates, utilizing “new and revised source data that are more complete and more detailed than previously available.” For Arkansas, the revision showed significantly higher growth over the past five years than did the previously-published data. The newly-revised data show that Personal Income in Arkansas for the first quarter of 2024 was $12.2 billion higher than previously estimated—an upward revision of 7.2%.
Source: Bureau of Economic Analysis
A breakdown of the sources of revision shows that the gains were positive across all major components, and generally larger for Arkansas than for the U.S. data (with the exception of Transfer Receipts). Of particular significance are the revision so Proprietors’ Income and Dividends, Interest, and Rent.
Source: Bureau of Economic Analysis
The increase in estimates of Dividends, Interest, and Rent amounted to nearly $9 billion as of the first quarter of 2024, accounting for 73% of the full revision to Personal Income.
Source: Bureau of Economic Analysis
The upward revision to Proprietors’ Income amounted to nearly 1.5 billion—accounting for 18.4% of the total revision to first quarter personal income. Both farm and nonfarm were substantially revised upward, with farm income accounting for 8.3% of the first quarter revision, and nonfarm proprietors’ income accounting for 3.8%.
Source: Bureau of Economic Analysis
Although the second quarter statistics show somewhat disappointing income growth, the revisions show that the quarterly slowdown in personal income growth—such as it is—appears as a minor distraction from more positive long-term trends.
The monthly employment report for August continued to show healthy labor market conditions for the State of Arkansas. The unemployment rate was unchanged at 3.3%, significantly lower than the national unemployment rate of 4.2%. After coming back down from a high of 3.7% at the end of 2023, Arkansas unemployment rate in August was slightly lower than it was one year earlier.
Source: Bureau of Labor Statistics
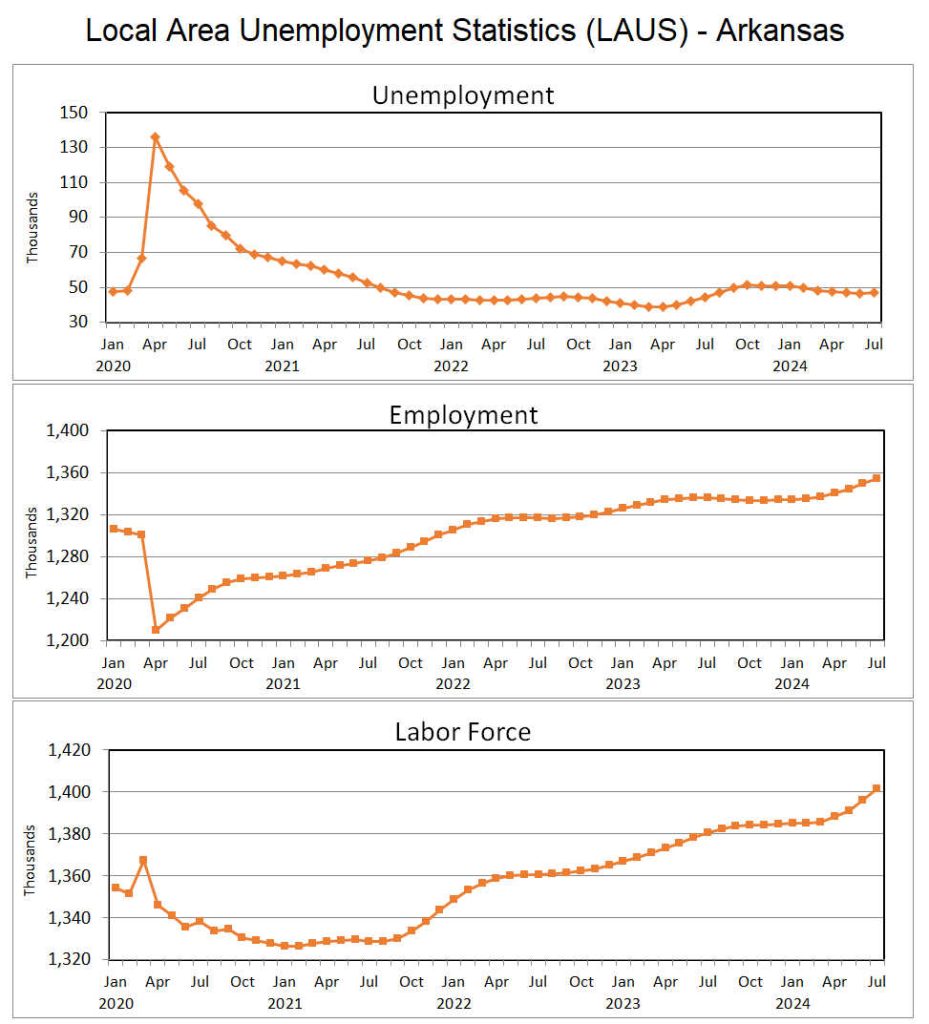
Underlying the stable unemployment rate was a small decline in the number of unemployed (-54) and a substantial increase in the total number of employed (+4,116). Household employment has now gone for ten months without a monthly decline, and is up 23,681 from August 2023. The Labor force has shown consistent growth as well—particularly over the past three months.
Source: Bureau of Labor Statistics, Local Area Unemployment Statistics (LAUS)
Recent increases in the labor force have had the effect of raising Arkansas’ labor force participation rate. As of the most recent observation, labor force participation is now at 58.0%—essentially the same as the rate that prevailed during 2019.
Source: Bureau of Labor Statistics
Payroll Employment Nonfarm payroll employment increased by 2,900 jobs in August. However, the figure for July was revised downward by 1,300 (-3,000, revised) so that the August employment level was basically unchanged from June. Nearly every sector saw employment increases in August, with the notable exceptions of Leisure & Hospitality Services and Other Services. Manufacturing was up for both durable and nondurable goods. After sagging for four months, employment in Construction rebounded with 700 net new jobs in August. Similarly, Professional and Business Services and Education & Health services showed robust increases for the month.
Source: Bureau of Labor Statistics, Current Employment Statistics (CES)
Employment in Leisure and Hospitality services declined by 2,000 jobs in August—the fourth consecutive monthly decline. Nevertheless, having increased sharply in the first three months of the year, total employment in the Leisure & Hospitality sectors is down only 400 jobs since December of 2023. One speculative explanation for this unusual pattern is that firms in the Leisure & Hospitality sectors added staffing in advance of the total solar eclipse event in April 2024, and have since gone back to sustainable employment levels.
Source: Bureau of Labor Statistics, Current Employment Statistics (CES)
# # #
Seasonally adjusted data for Arkansas nonfarm payroll employment, reported in a format consistent with the monthly news release from the Arkansas Division of Workforce Services, can be found here: Table-Seasonally Adjusted NFPE.
Recent conditions in the nation’s labor markets have been characterized as a labor shortage, prompting attention to trends in labor force participation. The issue is particularly relevant for Arkansas, where the rate of unfilled job openings has been running higher than the national average while labor force participation rates are consistently lower than the U.S.
This article presents an analysis of Arkansas’ labor force participation rate, examining the demographic and behavioral factors that underlie the gap between the overall state and national rates.
Long-term Trends
As shown in Figure 1, the U.S. labor force participation rate rose steadily from the early 1960s to around 2000, and has been declining over the first quarter of this century. The participation rate in Arkansas has generally followed the same pattern over time, but has been persistently lower than the U.S. rate. The gap between the two rates has varied between 3% and 5%, and has recently been near the top of that range.
Figure 1:
The forces driving the long-term increase and decline in labor force participation rates are generally attributed to underling participation rates of men. From around 1960 through 2000, the participation rate of women rose dramatically, levelling off during the first decade of the century and declining more recently. Meanwhile, participation rates for men have gradually but consistently trended lower.
Figure 2:
Data for the breakdown of participation rates by sex for Arkansas are available only for 1997 through 2023. As shown in Figure 3, participation rates for both men and women in Arkansas have trended below the national averages, with the gaps varying in the range of 3% to 5%. Recent gaps for both men and women have been near 5%.
Figure 3:
Participation Rates by Age Cohorts
Another important factor for understanding overall labor force participation rates is age. As shown in Figure 4, there is a clear life-cycle patter: Participation rates are relatively low for both the youngest and oldest cohorts, and they peak during the prime working ages of 25-44. While there is a tendency for participation rates to drop off in the 45-54 and 55-64 age ranges, the decline is more pronounced for Arkansas. Note that the participation rates for younger workers (16-19 and 20-24) are higher for Arkansas than for the U.S. The gap reverses and widens as we move to higher age brackets.
Figure 4:
The population distribution matters as well. Figure 5 shows that Arkansas’ population shares of both younger and older workers are higher than the U.S. average, while shares of those in the ranges of 25 to 53 are lower than average.
Figure 5:
Consequently, even if participation rates for each age cohort was the same for Arkansas and the U.S., Arkansas would have a lower overall participation rate due to the prevalence of younger and older workers (with relatively low participation rates) and the shortfall of middle age workers (who tend to have significantly higher participation rates).
Decomposition by Age
As suggested in the previous section, the overall labor force participation rates for Arkansas and the U.S. can differ for two reasons. Both the differences in age distributions, and the differences in participation rates within age cohorts contribute to the total gap between U.S. and Arkansas labor force participation rates.
To decompose the total gap into two distinct components, we can write the labor force participation rate, R, for either Arkansas or the U.S. as the share-weighted sum of age-bracket components. For n distinct age-group categories,
Where Siis the share of the population in cohort i, and Riis the participation rate for that cohort. The overall labor force participation rate is then the sum of the n components.
With this decomposition in hand, we can investigate two hypothetical questions:
What would the Arkansas labor force participation rate be if the age distribution in Arkansas matched that of the U.S.?
What would the Arkansas labor force participation rate be if participation rates within each age group matched those of the U.S.?
The data used for this exercise are the 2022-23 averages shown in Figures 4 and 5, which show the U.S. participation rate to be 62.4% and the Arkansas participation rate to be 57.4% — a gap of a little over 5.0 percentage points.
The results of this decomposition are shown in Table 1. The first line of Table 1 shows the actual participation rate for Arkansas, as well as the U.S. minus Arkansas gap. The breakdown by age group for the first line of the table displays each of the Si Ri terms from the equation above. The contributions from the youngest two age groups are negative (i.e., narrowing the gap) since participation rates within these cohorts are slightly higher in Arkansas than for the U.S.
Table 1:
The second line refers to Question 1: If we use U.S. population shares instead of Arkansas population shares, the Arkansas participation rate would be 58.3% — nearly a full percentage point (0.95) higher than the actual rate. The components by age group in the second line show the portions of the gap that are explained by the hypothetical. The contributions are negative at both the low end and high-end of the age ranges because U.S. population shares are smaller for those age groups. If the population distribution in Arkansas was the same as the U.S., those high and low age brackets would be smaller and therefore contribute less to the overall labor force participation rate. In the middle-age ranges U.S. population shares are higher, so raising the Arkansas population shares would tend to raise the overall participation rate, closing the gap between the U.S. and Arkansas.
The next line refers to Question 2: If labor force participation rates for all age cohorts were the same in Arkansas as for the U.S.—holding population shares constant—the overall labor force participation rate for Arkansas would be 61.5%, a gap of less than one percentage point. We call this the “behavioral” component of the gap because it refers to the labor force decisions made by individuals within each of the age brackets. In this hypothetical, the lower age brackets show negative contributions because imposing the (lower) U.S. participation rates for these age groups would reduce their contribution to the total. For the older age brackets, the effect of raising participation rates would help close the overall gap between the U.S. and Arkansas.
The final line in the table is labeled as a residual. It is the portion of the gap that is not explained by either of the two hypothetical exercises individually, but represents the small component that is explained by the interaction between differences in population shares and participation rates.
Among the contributions by age group in Table 1, the greatest impact in closing the gap between the U.S. and Arkansas participation rates would be raising the participation rates for those in the 45-54, 55-64 and 65+ age cohorts, each of which would close the gap by more a percentage point or more. The demographic mix matters too. As noted above, the smaller population shares for the middle age cohorts (25-54) are important contributing factors to the gap.
Decomposition by Age and Sex
In the previous section, we considered n=7 distinct age cohorts. The decomposition can be expanded to consider more detailed breakdowns as well. In the available data for Arkansas, the youngest and oldest age brackets are not broken down by sex. However, the age brackets in the range of 20-64 are reported separately for men and women.
Figures 6 and 7 show the labor force participation rates and population shares, respectively, for the U.S. and Arkansas.
In Figure 6, the breakdown of the rates for men and women shows some interesting differences. For the 20-24 age bracket, Arkansas participation rates are higher for both men and women. In the 25-34 cohort, however, the Arkansas participation rate is higher than the national average for men, but notably lower for women. Arkansas participation rates are lower than the U.S. for both men and women in the 35-64 age brackets, particularly in the 45-54 and 55-64 age ranges. Among men aged 45-54, the U.S. minus Arkansas gap is over 11 percentage points.
Figure 6:
Figure 7 shows that the relative sizes of population shares are generally similar for men and women. The exception is for the 25-34 cohorts, where the population share in Arkansas is smaller for men, but larger for women.
Figure 7:
Table 2 shows the decomposition of the U.S. minus Arkansas participation rate gap, with the more detailed breakdown of population cohorts. The two hypothetical calculations show the same overall result (with tiny differences associated with using the sums of averages over two years). The contributions of the youngest cohort and the oldest cohort are identical, since those to categories are the same.
In the second row of Table 2, using U.S. population shares and holding the labor force participation rates of the individual cohorts constant, the effects for the 20-24 and 55-64 cohorts widen the gap for both men and women, reflecting the fact that Arkansas has higher population shares in each of these categories. The contributions of men 25-34 and women 25-34 differ in sign, reflecting the relative magnitudes of the U.S. and Arkansas shares for those cohorts. The positive contributions to closing the gap are primarily for men and women in the 35-54 brackets, with a more substantial impact coming from the low population share for men aged 45-54.
The third row calculates the reduction in the gap that would take place if all participation rates within the age and sex cohorts were the same for Arkansas as the U.S. For older workers, raising the Arkansas participation rate would significantly close the gap, particularly for men. An important difference between the gender cohorts is for the 25-34 age range: Arkansas men in that age group display slightly higher participation rates in Arkansas, while the participation rates of women in that age range are lower than the U.S.
Table 2:
Conclusions
The decompositions described in this article are merely an arithmetic exercise, designed to identify how the relative sizes and labor force participation rates of demographic age and sex cohorts contribute to the gap between the overall participation rates of the U.S. versus Arkansas. The key results are quantified in two numerical decompositions, but they derive from some basic observations about the patterns in the data.
If Arkansas had more prime working-age workers (25-54) and fewer younger workers (16-24) and fewer older workers (55-64 and 65+), the higher participation rates for prime age workers would increase Arkansas’ labor force participation rate, but only by about 1 percentage point.
If the participation rates of older workers in Arkansas was higher, particularly in the 45-54 and 55-64 age brackets, a considerable portion of the gap between the U.S. and Arkansas would be narrowed. This is particularly true for men, but applies to a slightly lesser extent to women as well. The net effect of having participation rates in Arkansas as high as the national averages would be to narrow the gap from 5 percentage points to 1 percentage point.
The most notable difference between the participation rates of men and women can be seen in the 25-34 age range. The participation rate for Arkansas men is higher than the national average, while the rate for women is noticeably lower.
The differences between U.S. and Arkansas participation rates for individual age and sex cohorts have been referred to as behavioral, but a deeper examination would likely yield demographic explanations for those differences as well. For instance, the higher participation rates for Arkansas men and women in the 20-24 age range is probably related to the lower rate of higher education enrollment in Arkansas. People tend to enter the labor force at a younger age.
Similarly, the relatively sharp drop-off in participation rates for older workers in Arkansas could be associated with a higher prevalence of jobs for which disability or other early-retirement motivations are factors.
The distinctive pattern of participation rates for men and women in the 25-34 age range corresponds to prime child-rearing years. We might speculate that Arkansas has more families in which the man is working and the woman is at home taking care of the children. This could, in turn, be related to the proportion of children (<16 years old) in the population.
These speculative explanations for the labor force participation gap raise interesting questions that are worthy of further investigation and research.
The labor force participation rate is defined as the Labor Force (employed plus unemployed) expressed as a proportion of the population (civilian noninstitutional population age 16 and over). We can divide both the numerator and denominator into the sum of distinct components, i = 1, 2, …n. It is straightforward to show that this ratio of sums can be expressed as a share-weighted sum of individual participation rates for each cohort Ri , where the share-weights are defined as population shares, Si .
Updates to the data on employment and unemployment for metropolitan areas were released earlier this week. For Arkansas’ MSAs, there was little to take note of—except for the fact that softening labor market conditions in the rest of the nation does not seem to be taking hold here in Arkansas.
For example, the U.S. unemployment rate rose by 0.2 percent in July to 4.3% and Arkansas’ rate was unchanged at 3.3%. As shown in the table below, unemployment rates were unchanged in most of Arkansas’ metro areas, with the exception of small upticks in Memphis and Pine Bluff.
Source: Bureau of Labor Statistics, Smoothed seasonally adjusted metropolitan area estimates.
After rising through the second half of 2023, unemployment rates in most of Arkansas metro areas have been coming back down over the first half of 2024. As a result, unemployment rates across the state are little changed compared to a year ago, while the national unemployment rate has risen 0.8 percent. The exception to the general pattern has been Texarkana, which has followed the contrary pattern of lower unemployment in the second half of 2023 and a return to higher rates in 2024.
Source: Bureau of Labor Statistics, Smoothed seasonally adjusted metropolitan area estimates.
Payroll Employment Nonfarm payroll employment showed mixed changes, with monthly declines in Jonesboro and Texarkana and relatively large increases in Pine Bluff and Hot Springs. Other metro areas were unchanged or up slightly.
Source: Bureau of Labor Statistics, Current Employment Statistics (CES)
Relative to a year earlier, payroll employment has increased in all metro areas except Memphis. Compared to February 2020, before the disruption of the Covid contraction, employment remains lower in Memphis, Pine Bluff and Texarkana. All other metro areas have shown positive growth, particularly in Northwest Arkansas, but also with solid increases in Jonesboro and Central Arkansas.
Source: Bureau of Labor Statistics, Current Employment Statistics (CES)
The latest report on state employment and unemployment continues to suggest that Arkansas is not being substantially effected by the softening labor market conditions nationwide. With the U.S. unemployment rate rising 0.2 percentage points in July to 4.3%, today’s report shows the Arkansas unemployment rate was stable at 3.3%.
Source: Bureau of Labor Statistics
The household survey showed another significant increase in employment in July, up by nearly 5,000 (+4,918). In just the past six months, household employment has increased by over 20,000. The number of unemployed edged slightly higher in July (+211), but that was the first increase since January and the number of unemployed remains well below the 50,000 benchmark at the start of the year. The combination of increasing employment and unemployment meant that there was another boost to labor force participation (+5,129)—the sixth consecutive monthly increase.
Source: Bureau of Labor Statistics, Local Area Unemployment Statistics (LAUS)
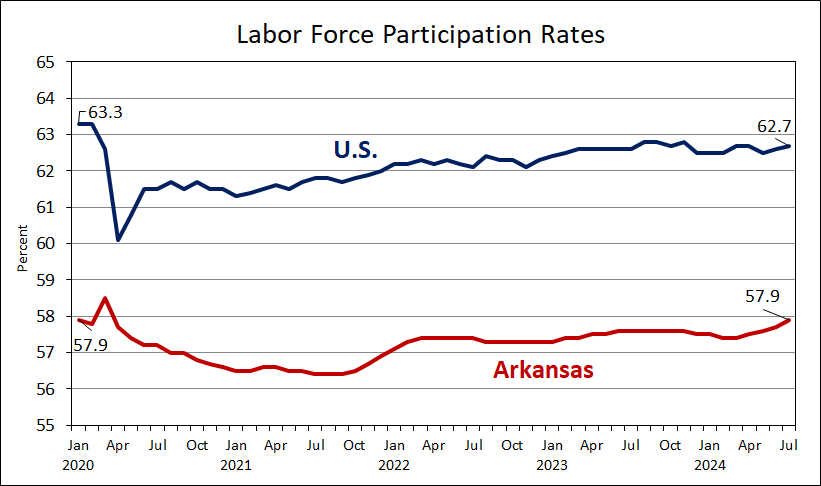
Recent labor force growth as been reflected in the labor force participation rate, which rose to 57.9% in July—fully recovering from the low rates that have prevailed over the past four years. Increases in the participation rate should alleviate some of labor shortage conditions, as reflected in the still-elevated but declining number of unfilled vacancies (See JOLTS).
Source: Bureau of Labor Statistics
Payroll Employment Nonfarm payroll employment declined by 1,700 jobs in July (seasonally adjusted). The large increase in the previous month was revised downward by 3,400 jobs, but remains a net increase of 5,300 for June. Most sectors showed small changes in July, with some notable exceptions. Other Services (which includes repair and maintenance services, personal services, etc.) declined by the same number of jobs as the total—a huge proportionate decline for a relatively small sector. Looking back to the previous month, however, there was an unusually sharp increase, which July’s change reversed. Professional and business services declined by 800 jobs in July, with a sharp dop-off in Professional, Scientific, & Technical workers but increases in other subsectors.
Source: Bureau of Labor Statistics, Current Employment Statistics (CES)
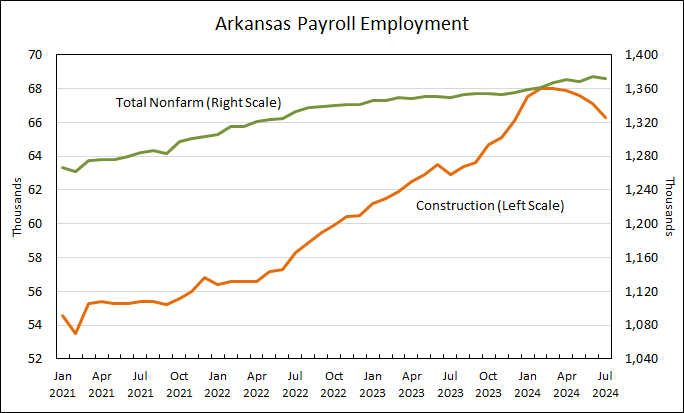
Employment in Construction also declined sharply (-800 jobs). Severe weather during the survey reference period might have had an impact on the monthly drop. Nevertheless, growth in construction employment, which had been exceptionally strong during 2022 and 2023, has been sagging during the first half of 2024.
Source: Bureau of Labor Statistics, Current Employment Statistics (CES)
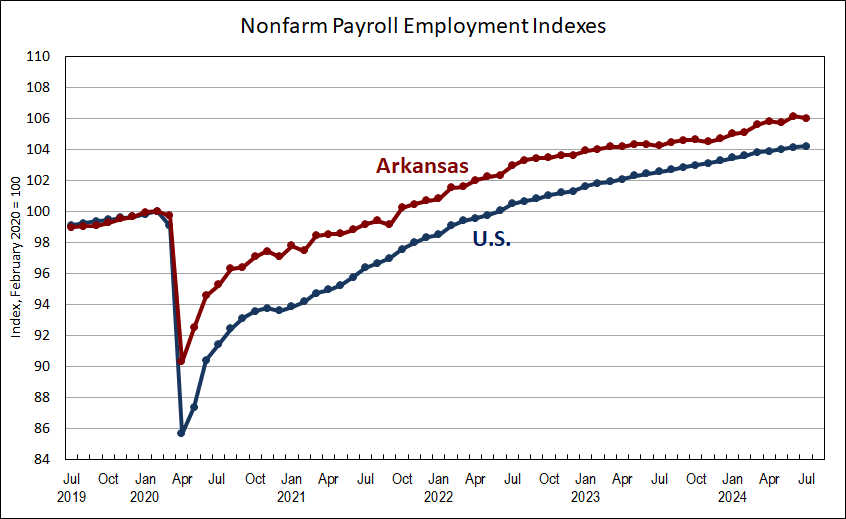
Despite the July decline, Arkansas payroll employment remains near its all-time high, and has increased by 1.7% over the past twelve months. U.S. job growth was 1.6% over the same period.
Source: Bureau of Labor Statistics, Current Employment Statistics (CES)
# # #
Seasonally adjusted data for Arkansas nonfarm payroll employment, reported in a format consistent with the monthly news release from the Arkansas Division of Workforce Services, can be found here: Table-Seasonally Adjusted NFPE.
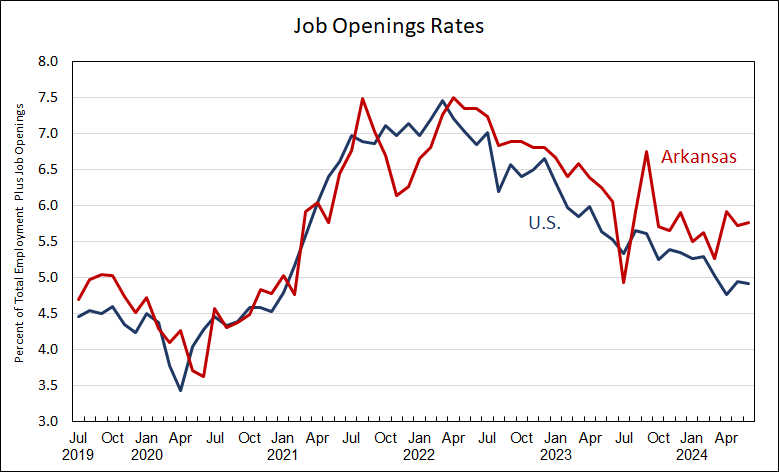
One of the unique characteristics of the post-COVID economy has been an exceptionally high number of unfilled job vacancies. Data documenting this phenomenon is available from the Bureau of Labor Statistic’s Job Openings and Labor Turnover Survey (JOLTS). Along with the employment and unemployment data for July, the BLS this morning released the latest JOLTS numbers for June.
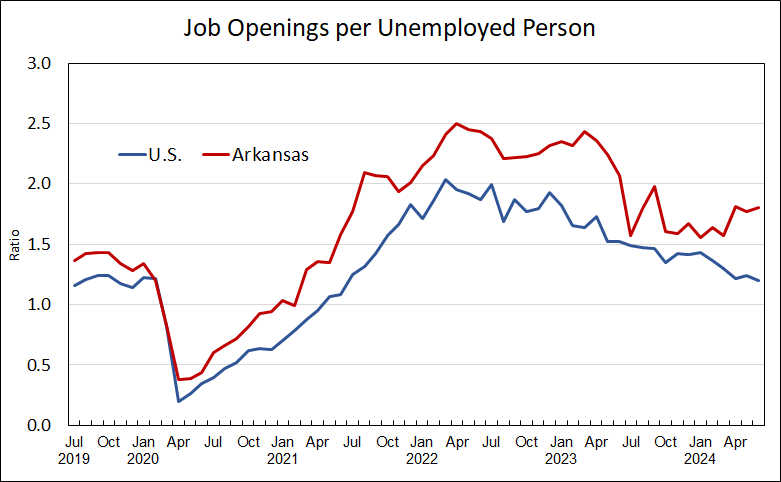
As national labor market conditions have softened in recent months, some of the slack has come from a decline in job openings. One popular measure is the ratio of Job Openings to Unemployed Persons. As shown below, this ratio has been in decline over the past two years, both nationwide and here in Arkansas. Nevertheless, the Arkansas ratio remains elevated, and has increased since the beginning of the year. As of June, there were 84,000 job openings and 46,530 unemployed in Arkansas, implying that there are 1.8 job openings for each unemployed person. In the U.S. data, the ratio has fallen to 1.2.
Another way to measure the importance of unfilled vacancies is to consider the Job Openings Rate, defined as the number of job openings as a percent of the total potential employed labor force (employment + job openings). By this measure, Arkansas has also remained higher than the U.S. average.
The elevated job openings rate for Arkansas helps explain how the state’s unemployment has remained low while the unemployment rate has been rising nationally. Job openings rates are returning to a more normal level for the U.S., meaning that some of the labor market softening is showing up in higher unemployment instead of fewer vacancies. The relatively high rates of vacancies in Arkansas has helped keep unemployment in the state from rising.
Another feature of the labor turnover data that has been of interest in recent years is the Quit Rate, the number of voluntary separations as a fraction of total employment. As shown below, the quit rates for both the U.S. and Arkansas have been trending down from their unusually high levels in 2021. Quit rates, like the Job Openings rates, have been steadily declining since interest rates started rising in 2022, and have returned closer to pre-pandemic levels.
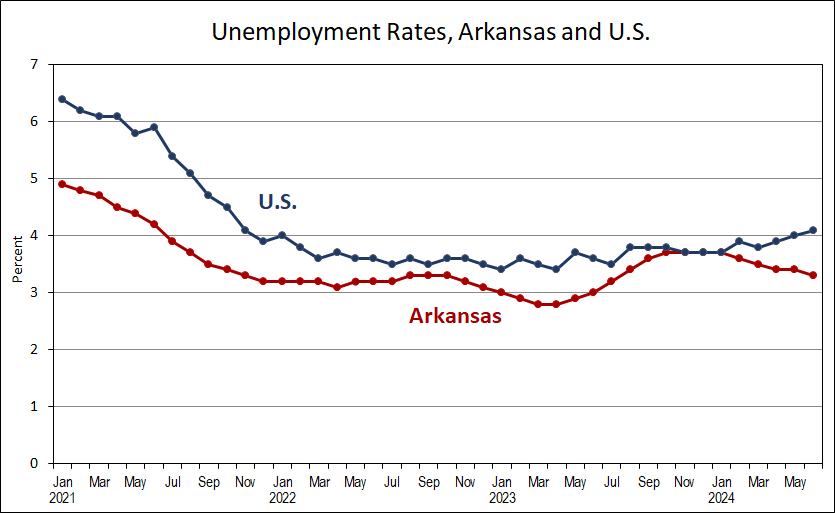
The June report on state-level employment and unemployment was unambiguous: Arkansas labor markets continue to show strength. Unemployment was down, with employment and labor force participation rising.
Arkansas unemployment rate declined by 0.1 percentage points in June, falling to 3.3%. If calculated with more precision the rate declined by only .04 percentage points, with the 0.1 pp measured to the nearest tenth. Nevertheless, the slight decline in Arkansas along with an increase in the U.S. rate for June means that Arkansas’ unemployment rate is now statistically significantly lower than the national average.
Source: Bureau of Labor Statistics
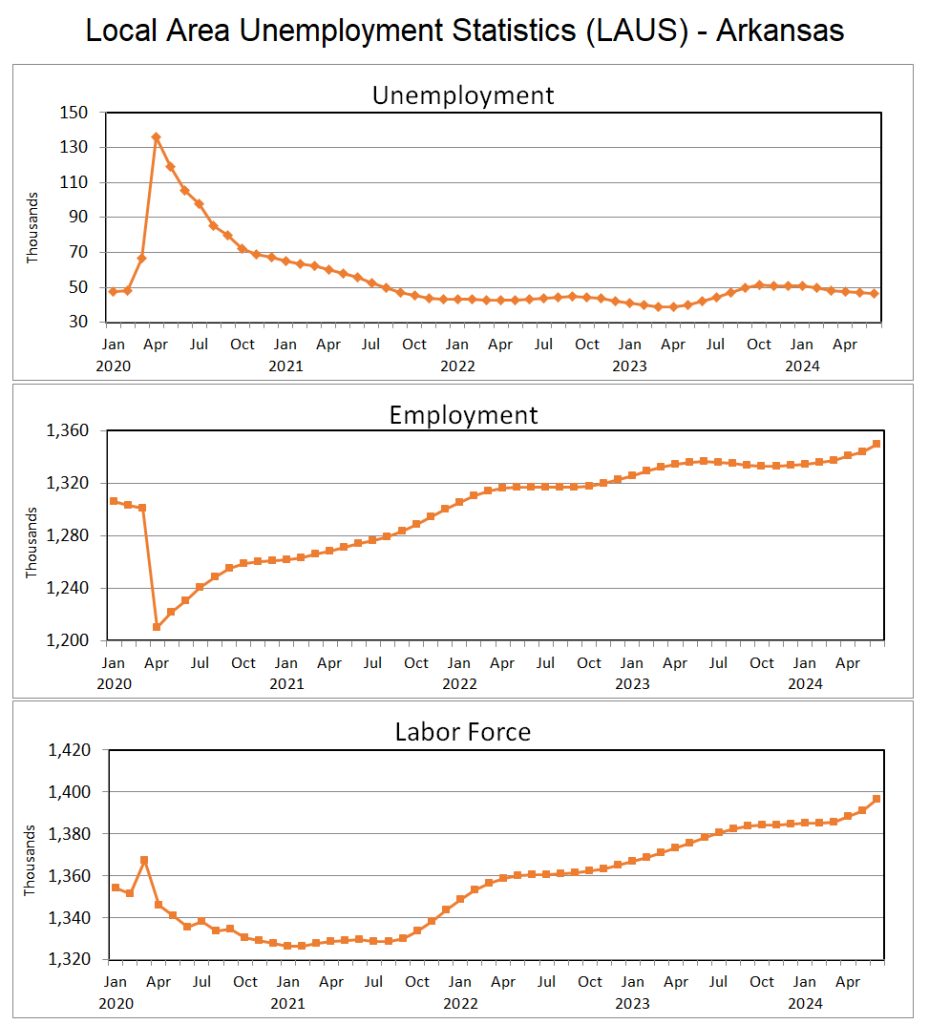
The underlying data from the household survey were all strong. The number of unemployed declined by 422, bringing the cumulative decline over the first half of 2024 to 4,221. The number of employed rose sharply, up 5,628. Household employment growth has accelerated in the second quarter of 2024, and over the first six months of the year employment has increased by 15,843. The increase in employment in June drove another increase in the labor force, up 5,206 for the month.
Source: Bureau of Labor Statistics, Local Area Unemployment Statistics (LAUS)
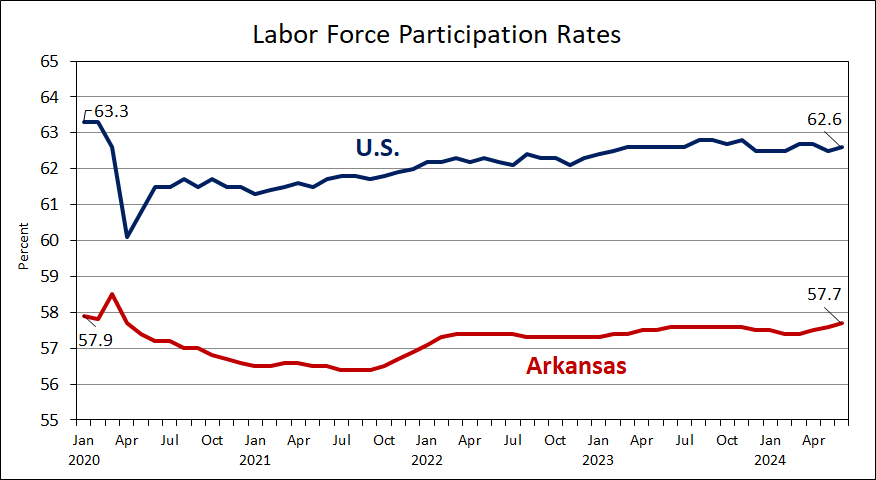
The acceleration in household employment and labor force growth have driven Arkansas’ labor force participation rate up by 0.3 percentage points over the past three months. It now stands at 57.7%, nearly equal to the rate at the beginning of 2020.
Source: Bureau of Labor Statistics
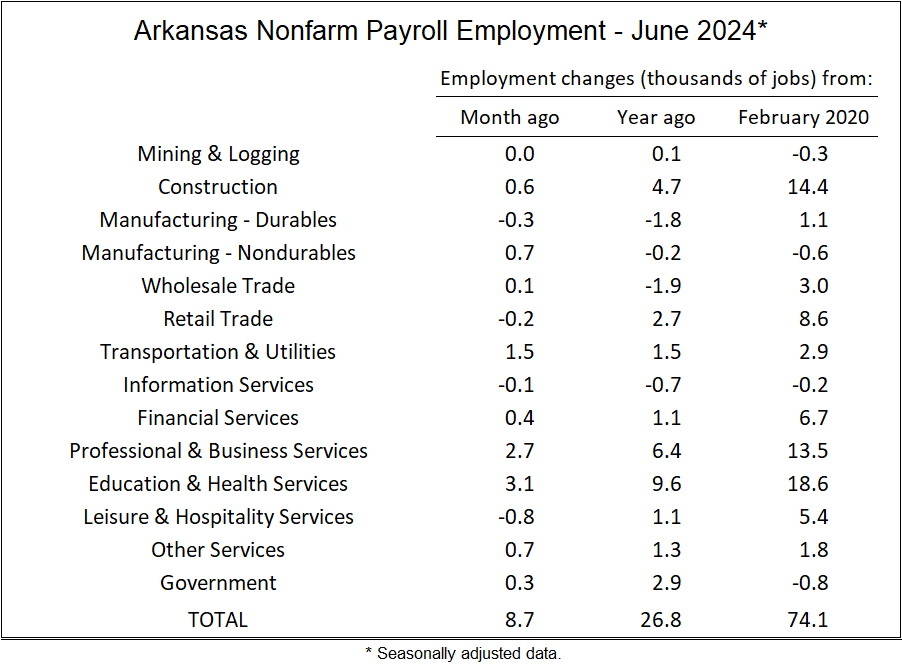
Payroll Employment Nonfarm payroll employment grew by 8,700 jobs in June, an increase of 0.6% (seasonally adjusted). The increase was among the highest percentage increases in the nation (essentially tied with New Hampshire and New Mexico). Increases were particularly prominent in Professional & Business Services and Education & Health Services (particularly health care). Gains were also registered in Construction, Nondurables Manufacturing, and many service-providing sectors. Without seasonal adjustment, Leisure & Hospitality services increased for the month, but after accounting for seasonality, the data indicate less growth than is typically the case during June.
Source: Bureau of Labor Statistics, Current Employment Statistics (CES)
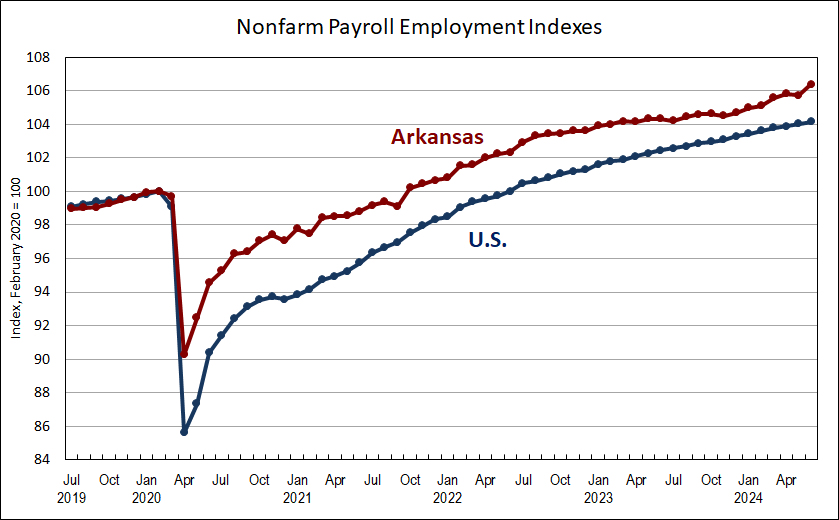
With the June increases, employment is up by 26,800 over the past twelve months–a percentage increase of 2.0%. Employment growth for the U.S. has been 1.7% over the same period.
Source: Bureau of Labor Statistics, Current Employment Statistics (CES)
# # #
Seasonally adjusted data for Arkansas nonfarm payroll employment, reported in a format consistent with the monthly news release from the Arkansas Division of Workforce Services, can be found here: Table-Seasonally Adjusted NFPE.
The AEDI index of Arkansas retail sales declined by 0.7% in the first quarter of 2024, while the Census Bureau’s Retail Trade and Food Services for the U.S. declined by 0.2%. Compared to a year earlier, the Arkansas measure is up by 1.2%, compared to an increase of 1.4% in the U.S. measure.
Sources: Arkansas Department of Finance & Administration, Arkansas Economic Development Institute, U.S. Census Bureau
First quarter sales in Arkansas were impacted by severe cold and ice in January. Nearly every retail sector showed a distinct decline in the monthly data. For example, the figure below shows sales for Furniture and Home Furnishing stores, where the decline in January 2024 is nearly as distinct as for the snowstorm of February 2021 (albeit without the sharp increase in the following month).
Sources: Arkansas Department of Finance & Administration, Arkansas Economic Development Institute, U.S. Census Bureau
The furniture store sector is also the most prominent among several that has been trending downward for several quarters–down 20% from a year ago. In the U.S. data, sales at furniture stores have declined by 11% over the past four quarters. Other sectors that have been declining in both Arkansas and the U.S. include Electronics and Appliance Stores, Building Materials Stores, and Gasoline Stations (the latter is primarily attributable to declining gasoline prices).
Sources: Arkansas Department of Finance & Administration, Arkansas Economic Development Institute, U.S. Census Bureau
Some elaboration on the Motor Vehicle and Parts Dealers data are in order:
The series on Motor vehicle and parts dealers required an adjustment to the timing of auto sales versus tax receipts during 2023. As of August 1, 2023, the time limit for car buyers to register their vehicles (and pay taxes) was raised from 30 days to 60 days. As a consequence, the timing of tax receipts relative to sales data had to be adjusted. Our approach was to assume that the lag between purchase and tax payment was a weighted average of one month and two months, with the weights evolving over the course of the year, but always summing to one. This had the effect of raising estimated auto sales during the year, and eliminating some of the volatility that emerged in the unadjusted data.
Sources: Arkansas Department of Finance & Administration, Arkansas Economic Development Institute
Carrying the analysis forward, the data for 2024 (assumed now to correspond to a two-month lag) shows a sharp drop in March 2024. March is typically a strong sales month for autos, so the seasonally adjusted decline corresponds to an increase in sales that was not proportionately as large as is “typical”. The result is a two percent decline for the first quarter of 2024.
Sources: Arkansas Department of Finance & Administration, Arkansas Economic Development Institute, U.S. Census Bureau
Going forward, we will continue to evaluate the timing of sales and tax revenues for motor vehicle sales. For now, consider a measure of total retail trade and food service sales that excludes autos. The quarterly decline for this measure was 0.3% (compared with -0.7% for the total that includes autos). Compared with 2023:Q1, the measure excluding autos was up by 0.3%, rather than by the 1.2% reported for the inclusive measure.
Sources: Arkansas Department of Finance & Administration, Arkansas Economic Development Institute, U.S. Census Bureau
One final note to bear in mind: The sales data are not adjusted for inflation. The nominal value of total retail sales was approximately 40% higher than average spending in 2019. After using the consumer price index to adjust for inflation, the growth in real consumer spending since 2019 has cumulated to only 15%.
Sources: Arkansas Department of Finance & Administration, Arkansas Economic Development Institute, U.S. Census Bureau, U.S. Bureau of Labor